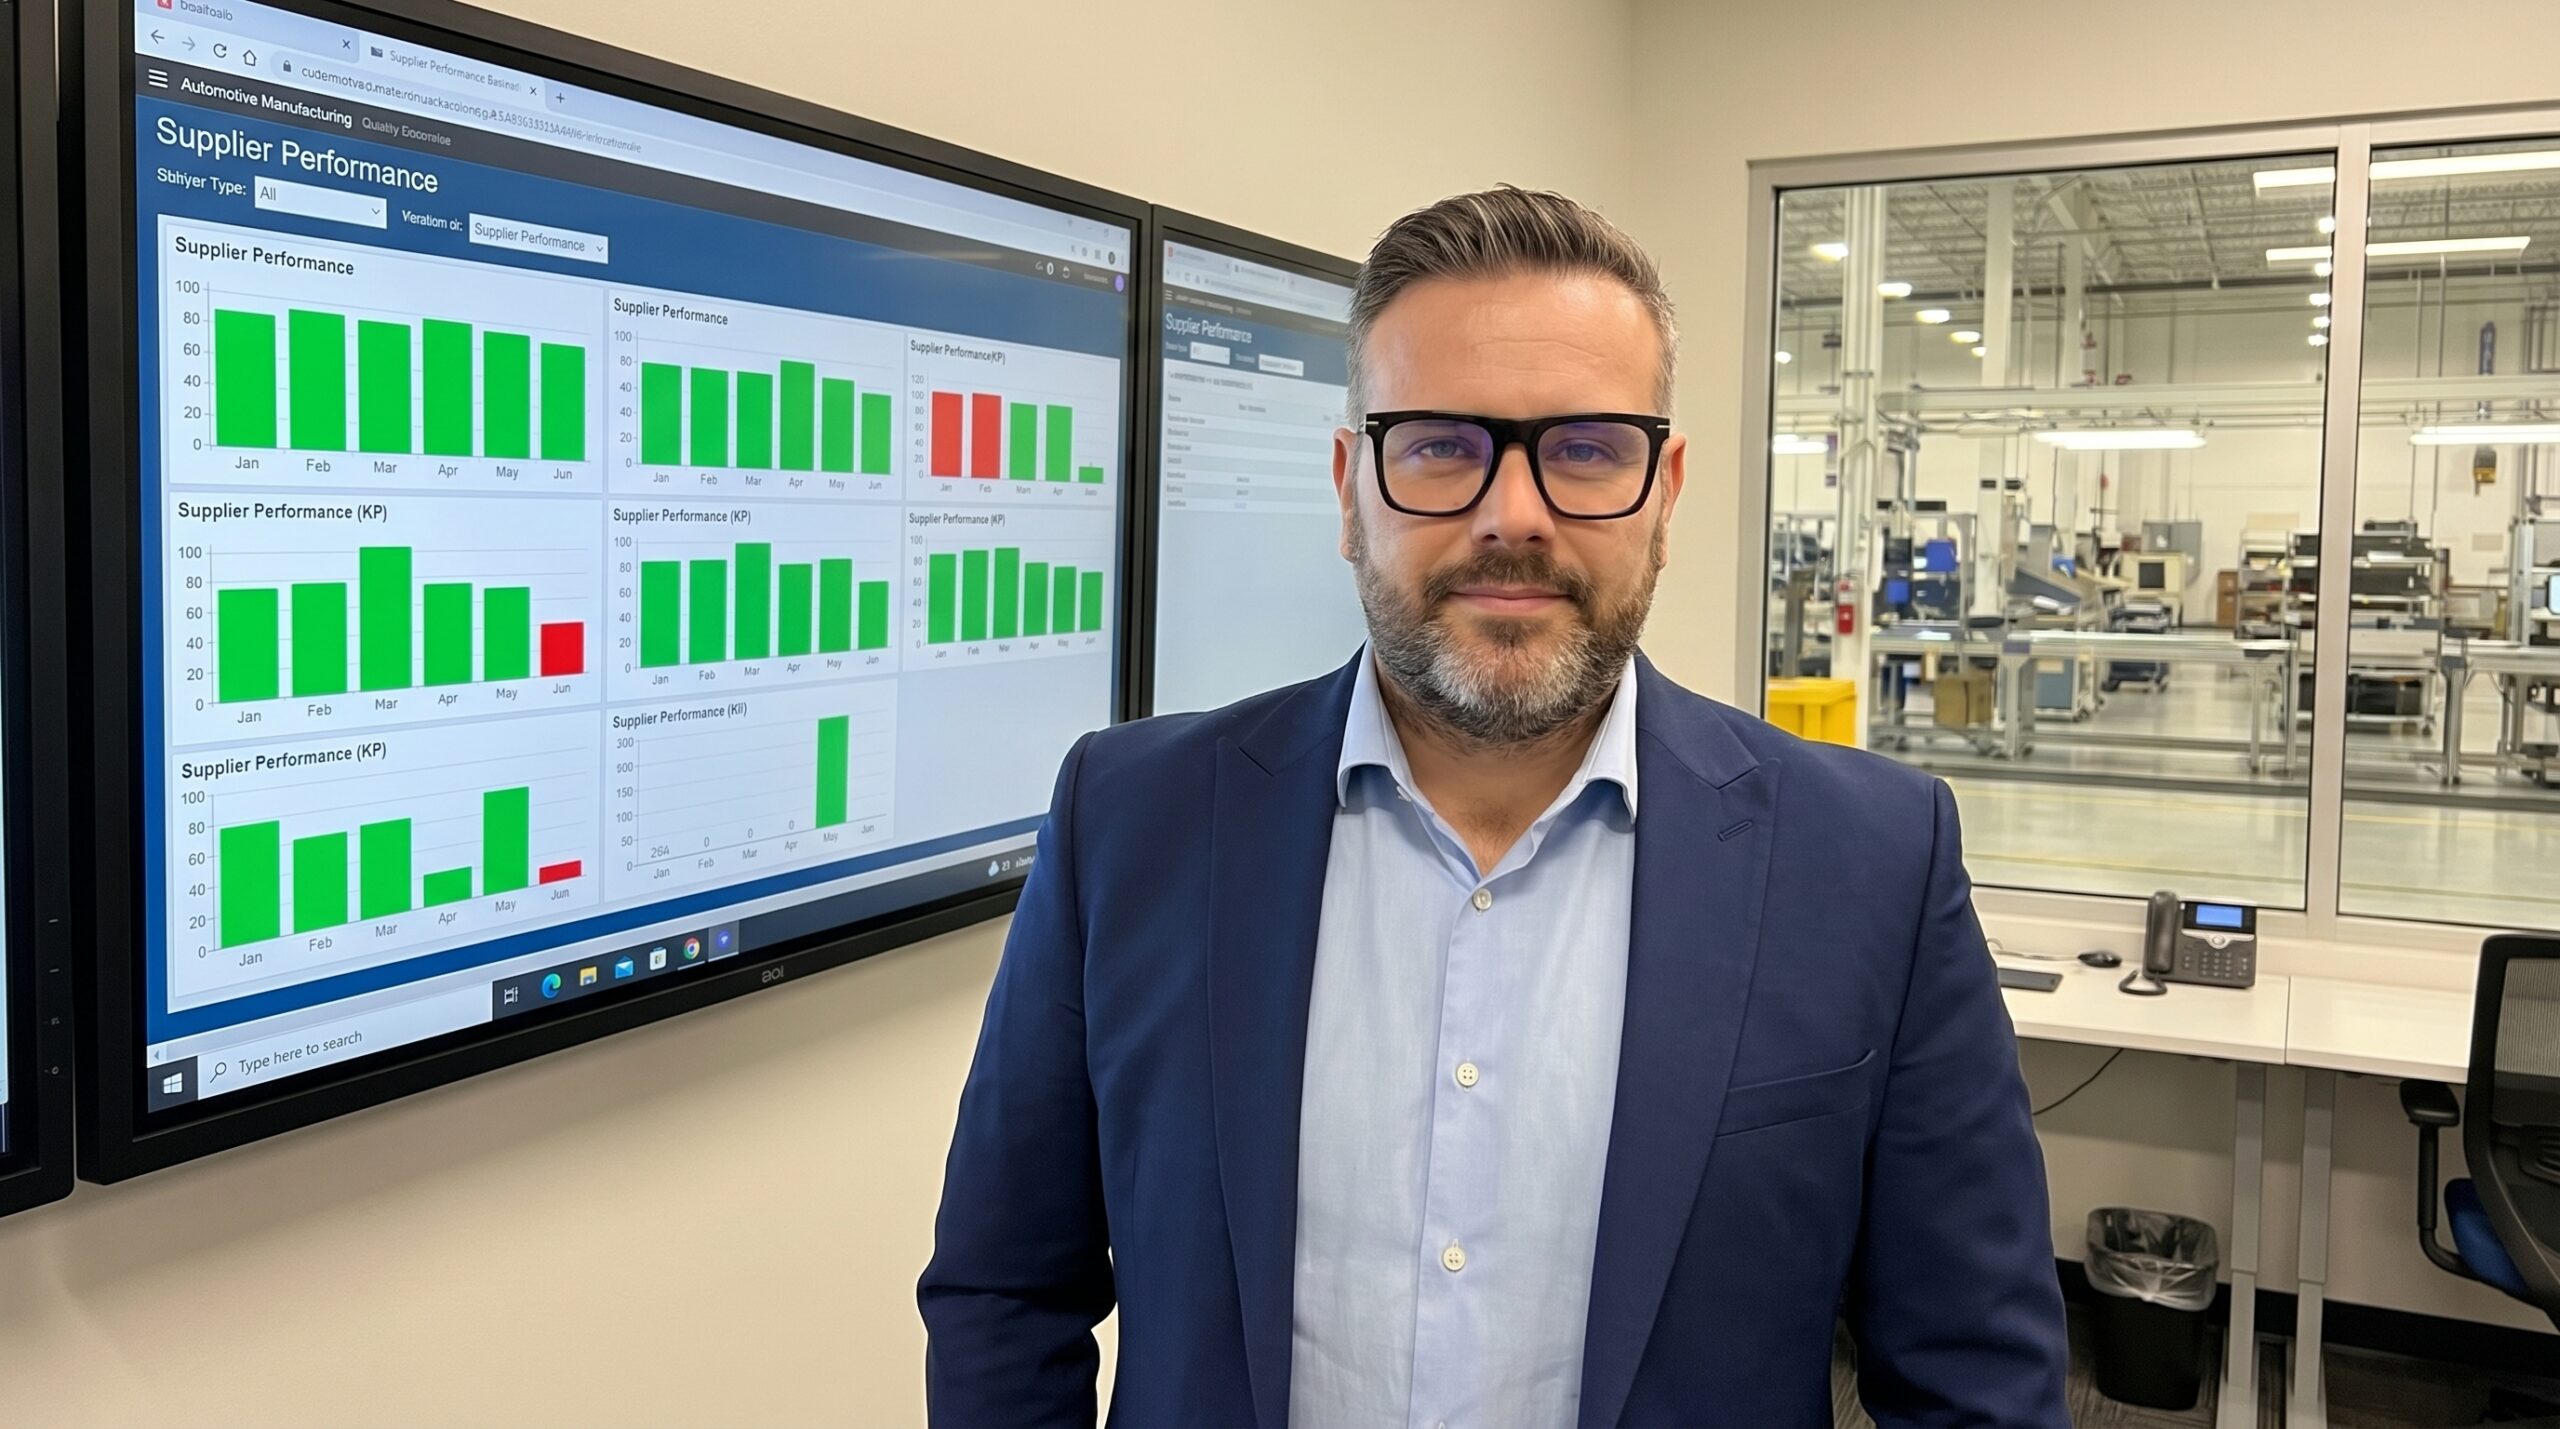
A plant director called me in February after a string of OEM rejections. He had seventeen suppliers causing chronic disruptions — late deliveries, quality escapes, unauthorised specification changes — and no objective data to justify why he was still buying from most of them.
I asked how many of those seventeen had received a formal, metric-based performance evaluation in the last twelve months. The silence on the line confirmed what I already suspected.
Most manufacturing plants manage their supply base reactively. Decisions are driven by the last 8D report, personal relationships, or raw unit price. A Supplier Scorecard replaces this chaos with a structured system, turning opinion-based management into objective, auditable governance.
Why Standard Compliance Is Not Enough
IATF 16949 and AS9100 require evidence of supplier development. But compliance with a mandatory clause and actual supply chain visibility are two different things. A scorecard maintained merely to survive an audit is dead weight.
A functional scorecard is a living mechanism. It measures, evaluates, and drives consequences. The gap between a company that files the document and one that runs the system is the gap between fighting fires and preventing them.

Core Dimensions of Supplier Evaluation
An effective scorecard merges multiple performance dimensions into a single, transparent rating. While weightings vary by industry, the categories remain constant.
Quality
This is the anchor. Metrics include PPM (Parts Per Million defective), percentage of delivered lots accepted without rejection, open 8D reports, and recent audit findings. In automotive, quality typically carries 35–45% of the total score. A part either meets the print specification or it does not.
Delivery
On-Time Delivery (OTD) must measure both time and quantity. A delivery that arrives on schedule but at half the ordered volume is not a success. It is a line-down event.
Cost and Responsiveness
Evaluate Total Cost of Ownership (TCO), not just unit price. Calculate the hidden costs a supplier generates: premium freight, line stoppages, and elevated inventory. Responsiveness measures their ability to absorb volume changes and engineering updates without destabilising the chain.
Partnership and Compliance
Strategic suppliers actively contribute to design improvements, cost-reduction initiatives (VA/VE), and process optimisation. Compliance covers ISO 14001 certification, material traceability, and adherence to REACH, RoHS, and Conflict Minerals regulations.
Structuring the Scorecard and Grading Scale
When sitting with that plant director, we stripped the evaluation down to five concrete metrics across three dimensions. We weighted them according to the plant's strategic risks.
| Dimension | Metric | Weight |
|---|---|---|
| Quality | PPM rate | 30% |
| Quality | Open CAPA > 90 days | 15% |
| Delivery | OTD (time + quantity) | 30% |
| Flexibility | Response time to change < 48h | 15% |
| Strategy | Participation in VA/VE projects | 10% |
Each metric is scored 0–100. The weighted sum determines the final grade, which dictates the commercial relationship.
- A (90–100%): Strategic partner. Preferred sourcing for new programs.
- B (75–89%): Stable supplier. Standard volume and ongoing monitoring.
- C (60–74%): Development plan required. Formal improvement plan with deadlines.
- D (<60%): High risk. Restricted from new quotes; exit strategy initiated.
During the first quarter of implementation, the data often challenges plant assumptions. The supplier everyone complained about scored 52% — a clear D. But a supplier the quality team disliked due to one massive rejection the prior year scored 88%. One catastrophic incident does not define a supplier's overall capability. That distinction is why the scorecard exists.
The Governance Cycle
Creating a document and filling it out once a year is an alibi, not management. A functional scorecard operates on a strict calendar.
Annual Scorecard Governance Rhythm
- 01Monthly MonitoringTrack operational metrics (PPM, OTD, complaints). A rising trend is a leading indicator of systemic failure.
- 02Quarterly ReviewCross-functional meeting (SQE, Purchasing, Logistics) to analyse trends and review action plan effectiveness.
- 03Annual Audit & DevelopmentOn-site VDA 6.3 audit for critical suppliers. Set targets and define exit strategies for recurring D-grade suppliers.
- 04Bidirectional FeedbackShare the results with the supplier. Listen to their feedback on your internal processes that cause delays.
Avoiding Common Implementation Failures
Tracking fifteen metrics guarantees nothing gets managed. Stick to five to eight critical indicators. Every additional metric dilutes focus and increases administrative drag.
Do not ignore negative trends. A supplier dropping from 95% to 85% to 78% is heading toward a failure state, even if 78% still looks acceptable on paper.
An evaluation without commercial consequences is just an opinion. Scorecards only work when they dictate volume and sourcing.
If a Grade D supplier faces no restrictions on new projects, the entire system lacks credibility. Furthermore, eliminate subjective inputs like "we have a good relationship with them." If you cannot measure it, do not score it.
Total Cost of Ownership in Practice
Unit price is a dangerous metric in isolation. I worked with a plant supplying a German OEM that sourced an aluminium block from three suppliers. Supplier X had the lowest unit price and won the largest volume share. When we implemented the scorecard, the reality shifted.
Supplier X graded as a C. Their PPM was 280, OTD sat at 78%, and they carried open CAPAs older than 120 days. Meanwhile, Supplier Y — costing 4% more per unit — held a PPM of 15, achieved 97% OTD, and proactively proposed a casting process change that reduced variation by 30%.
Unit Price vs. Total Cost of Ownership
Lowest Unit Price (Supplier X)
- PPM: 280 (High reject rate)
- OTD: 78% (Frequent line risk)
- Status: Grade C, high TCO
- Result: Chronic line stoppages
Optimal Value (Supplier Y)
- PPM: 15 (Near-zero rejects)
- OTD: 97% (Reliable throughput)
- Status: Grade A, proactive VA/VE
- Result: +4% unit cost, lower TCO
Purchasing defended Supplier X based on standard cost. Quality demanded Supplier Y based on capability. The scorecard settled the argument.
We shifted 60% of the volume to Supplier Y. The unit price increased, but annual costs for non-quality dropped by 340,000 euros. Eliminating the line stoppages caused by Supplier X saved another 180,000 euros. Paying a higher unit price yielded a net saving of over half a million euros annually.
Digital Integration and Getting Started
Modern QMS and ERP platforms like SAP QM or Siemens Teamcentre automate data collection and threshold alerting. But software accelerates the process; it does not define it. Automating a broken metric just generates bad data faster.
If you are starting from zero, do not boil the ocean. Identify the top twenty suppliers by volume and criticality. Define five core metrics. Retrieve the last six to twelve months of historical data. Run a baseline evaluation. Make your first sourcing decision based on the results.
A year after that February phone call, the plant director's facility won a Top Supplier award from their OEM. He told me the scorecard gave them the exact visibility they lacked — not just to identify the risk, but to recognise the reliable partners they had been ignoring.