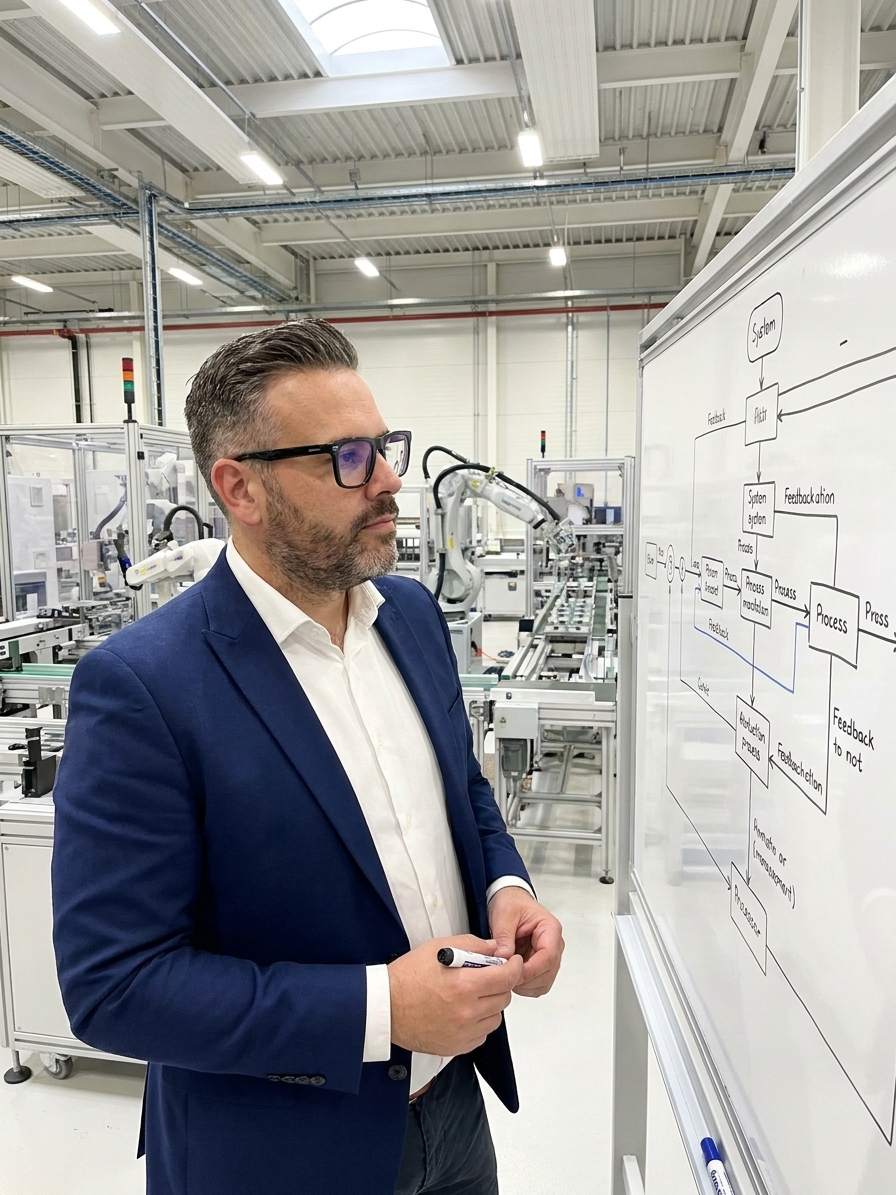
Three mechanics stand around a machine that has stopped. The first replaces a worn belt. The machine runs for twenty minutes and stops. The second adjusts the belt tension. It runs for an hour and stops. The third mechanic walks upstream, finds a leaking coolant line, traces the ignored leak reports to a defunct maintenance request system, and discovers the breakdown was predicted by vibration analysis data nobody reviewed because the dashboard was designed for a process that changed three years ago.
The first two mechanics fixed parts. The third understood the system. This is the difference between organizations that fight the same fires year after year and those that prevent them. It is not a difference in tools, training, or talent. It is a difference in thinking. Reductionist problem-solving dominates most quality departments because it is comfortable and measurable. It also guarantees recurrence.
Systems thinking is the recognition that nothing in your organization operates in isolation. Your defect rate is not a property of your inspection station. It is a property of the relationship between your design process, supplier selection, machine maintenance, operator training, scheduling pressure, measurement system, and a dozen other interacting factors your PFMEA flowchart does not capture.
Complicated Versus Complex: Why Standard Root Cause Analysis Fails
Standard management thinking is deeply reductionist. We break problems into parts, assign each part to a team, solve each part, and expect the whole to be solved. This works for complicated problems — problems with many components but predictable relationships. Building an aircraft engine is complicated. You can decompose it, assign components to engineers, and reassemble the solutions.
Quality problems in real organizations are not complicated. They are complex. The relationships between parts are dynamic, nonlinear, and often counterintuitive. The same cause produces different effects in different contexts. The same effect has different causes on different days. Intervening in one part of the system changes the behaviour of every other part in ways you did not predict.
This distinction is the reason your 8D root cause analyses keep identifying causes that, when eliminated, do not prevent recurrence. You found a cause. You did not find the systemic driver. In a complex system, there is no single cause. There is a pattern of interactions that produced the outcome, and unless you change the pattern, the outcome will recur — possibly in a different form, but with the same underlying dynamic.
The Iceberg Model: Seeing Below the Waterline
The iceberg model remains one of the most practical frameworks for applying systems thinking to quality. Most organizations operate at the tip — the visible events. A defect occurred. A customer complained. A shipment was late. These events trigger reactive investigations that address the immediate symptom while ignoring the structure that produced it.
Just below the waterline are patterns. The defect happens every Monday morning. Complaints spike after shift changes. Late shipments cluster around month-end. A rigorous Pareto analysis can identify these patterns, but patterns alone do not explain why they exist.
Deeper still are structures: the policies, resource allocations, and incentive systems that create the patterns. Monday defects correlate with weekend changeovers that are rushed because production targets do not account for changeover time. Complaints spike after shift changes because knowledge transfer between shifts is verbal and inconsistent. Late shipments cluster at month-end because the commission structure rewards volume over deliverability.
The Quality Iceberg: Levels of Systemic Intervention
- Events (Reactive)A defect escapes. A customer rejects a shipment. The visible symptom that triggers the 8D.
- Patterns (Analytical)The defect occurs every third shift. Scrap spikes after material changeovers. Identified via Pareto and SPC data.
- Structures (Systemic)Production targets ignore changeover time. Shift handovers are verbal. The scheduling pressure that forces the pattern.
- Mental Models (Foundational)Production targets are non-negotiable. We do not have time for formal handovers. The beliefs that sustain the broken structures.
At the base of the iceberg are mental models — the beliefs, assumptions, and values that sustain the structures. These models are rarely spoken aloud and almost never questioned. They drive every structure, pattern, and event in your quality system. Most quality interventions address events. Genuine transformation requires surfacing and changing the mental models underneath.
System Archetypes in Manufacturing
Systems thinking reveals that organizations do not have unique problems. They have recurring system archetypes that show up across industries. Recognizing these archetypes allows you to predict failure modes before they happen. Fixes That Fail is the most common archetype in quality. You apply a fix. The problem improves temporarily. Then it returns, often worse.
In manufacturing, Fixes That Fail manifests as mandatory overtime deployed to compensate for low OEE. The overtime creates operator fatigue, which causes dimensional errors, which reduces throughput further, which requires more overtime. The symptomatic solution feeds the root problem. Breaking the loop requires addressing the fundamental throughput constraint, not throwing labour at it.
Shifting the Burden occurs when an organization becomes dependent on a symptomatic solution and loses the ability to address the fundamental one. The classic quality example is adding final inspection headcount instead of improving process capability. The inspection catches defects, but the process continues producing them. Over time, the engineering capability to improve the process atrophies because all resources flow to containment.
In a complex system there is no single cause. There is a pattern of interactions, and unless you change the pattern, the outcome will recur.
Feedback Loops and the Delay Problem
Every quality outcome is produced by feedback loops, and most of them are invisible to the people operating inside them. Reinforcing loops amplify change. A culture where operators report defects openly generates more data, which drives better analysis, which leads to effective countermeasures, which reinforces the culture of openness.
Reinforcing loops also work in reverse. A culture where defects are punished leads to underreporting, which leads to incomplete data, which leads to poor analysis, which leads to ineffective improvements, which leads to more defects. The loop structure is identical. The outcome is opposite. Blame-driven management does not just fail to improve quality. It structurally guarantees degradation.
Balancing loops seek stability. SPC charts are balancing loops. Your calibration schedule is a balancing loop. Your CAPA process is a balancing loop. Most systemic quality failures occur because a balancing loop is broken, delayed, or overwhelmed. The feedback signal is too weak. The corrective action arrives three weeks after the nonconformance. The process variation exceeds the loop's capacity to correct.
Managing Systemic Delays
A new quality initiative launches. Six weeks in, the defect rate has not improved. Leadership declares the initiative a failure and pivots. Six months later, a different initiative produces similar non-results. This scenario plays out in manufacturing facilities globally. The problem is not the initiative. The problem is a fundamental misunderstanding of systemic delay.
Quality improvements operate through long feedback loops. Training changes operator behaviour gradually. Process changes work through existing WIP inventory before new material reflects the improvement. Cultural changes propagate at the speed of trust, not the speed of email. Premature intervention — abandoning an initiative before the feedback loop closes — destroys systemic improvement.
Thresholds for Systemic Process Health
Practical Application: Moving from Reductionist to Systemic
Map the system before you fix the part. Before implementing any corrective action, draw the feedback loops, the delays, the stakeholders, and the incentives. Do not limit the map to the process flow. You will find that the obvious fix frequently addresses a node with negligible influence on the final outcome.
Replace linear Five Whys with circular thinking. The Five Whys technique assumes a single, linear chain of causality. Systems thinking is circular. Trace what happens after your proposed fix. If the fix creates a new problem downstream, upstream, or in a parallel process, you have not solved anything. You have displaced the problem.
I have audited plants across automotive and aerospace where cross-functional failures shared one feature: the people who understood the problem were not in the room when the solution was designed. A design engineer specifies a tolerance the process cannot hold and quality cannot measure. None of the three departments talk until the customer rejects a shipment. Systems thinking requires systems-level conversations before the defect occurs.
Systemic Corrective Action Process
- 011. Identify the ArchetypeDetermine if the failure is a Fixes That Fail or Shifting the Burden loop before selecting a tool.
- 022. Map the Feedback LoopDraw the balancing and reinforcing loops that connect the defect to its systemic drivers.
- 033. Identify the DelayLocate the time gap between the root cause and the detected effect. Do not intervene before the loop closes.
- 044. Test for DisplacementTrace the proposed fix downstream. If it creates a new bottleneck, redesign the intervention.
- 055. Implement and MeasureApply the systemic fix. Measure the structural inputs, not just the event-level defect rate.
The mechanic in the opening story did not fix the machine. She fixed the system that was breaking the machine. She could only do that because she was willing to look beyond the broken part to the broken whole. The same applies to quality leadership. The operator who keeps making mistakes is likely responding rationally to the incentives, constraints, and information the system provides. Fix the system, and you fix the operator. Blame the operator, and the system continues producing defects.