Quality professionals love their tolerance limits. The prevailing mindset across production floors and supplier quality meetings is simple: hit the numbers, stay between the lines, and ship the product. As long as a part is in spec, it is considered fine. This binary framework assumes there is a cliff where one side of the tolerance limit is good and the other is bad.
Genichi Taguchi proved this assumption was mathematically flawed and financially dangerous. He demonstrated that quality is not about meeting specifications, but about minimizing deviation from a target value. There is no cliff. There is a continuous slope, and every millimeter of drift from the target generates a quantifiable loss. Organizations that ignore this slope absorb the resulting costs silently.
I have audited plants that boasted 100 percent first-pass yield, yet struggled with chronic warranty claims and customer escapes. The gap between their reported success and their financial reality was entirely explained by their reliance on a binary quality model. They were ignoring the quadratic cost of their in-spec variability. Taguchi provided the mathematics to expose and eliminate this hidden waste.
The Mechanics of the Loss Function
In the traditional quality view, the loss imposed by a product is zero as long as it falls within the specification limits. The moment it crosses out of spec, the loss jumps to a fixed value, typically the cost of rework or scrap. Graphically, this traditional model looks like a rectangle: flat at zero inside the spec limits, then a sudden vertical drop to a fixed loss value outside them.
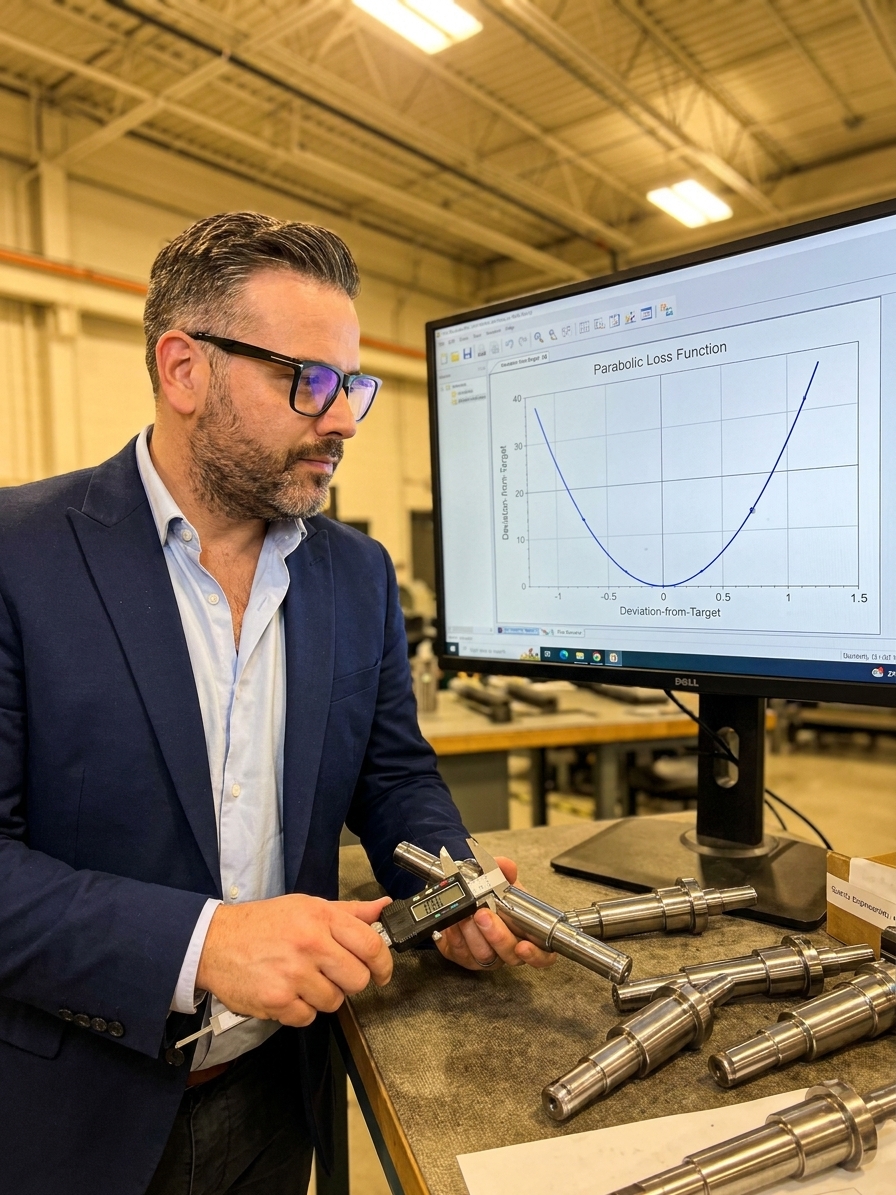
Taguchi proposed a different mathematical curve: a parabola. The loss is minimized at the target value and increases quadratically as the actual measurement moves away from it. The formula in its simplest form is L = k(x − m)². In this equation, L represents the loss, x is the actual measured value, m is the target value, and k is a constant that converts deviation into monetary loss.
The constant k forces engineering decisions into financial terms. Taguchi defined this loss as the total cost to society, which includes the manufacturer, the customer, and the supply chain. A marginal part creates downstream variability, increases warranty claims, and damages brand reputation. By calculating a specific dollar amount for deviation, the loss function transforms abstract statistical variation into an undeniable P&L statement.
The Cost of a Pass
Consider two machined parts. Part A measures exactly at the target value. Part B measures just barely inside the specification limit, perhaps 0.001 mm away from being out of tolerance. In a traditional quality system, both parts receive the same green checkmark and both get shipped to the customer. The inspection data records no difference between them.
In the Taguchi system, Part A imposes near-zero loss. Part B imposes a loss that is nearly as large as the loss from a part that is completely out of spec. The quadratic function dictates that the loss at the tolerance limit is already significant. A part sitting on the edge of the tolerance band is not a win; it is a structural failure disguised as a compliance success.
Scale this up to a production line outputting 50,000 units. If the process is centered on target but exhibits wide variability, the accumulated loss across all those slightly off-target parts becomes staggering. This is the insight that makes quality managers uncomfortable: in spec does not mean good. It merely means the part was not bad enough to reject.
Classifying Process Failures
Taguchi classified quality problems into three distinct categories. The first is an off-target condition, or a mean shift. The process consistently produces parts that average a deviation from the target. The entire bell curve has shifted. This is the easiest problem to fix: you recalibrate the machine, adjust the setup, and move the mean back to the target.
The second category is excessive variability, or a wide spread. The process mean is perfectly centered, but the scatter is too broad. Parts disperse widely around the target, and a few drift out of spec. This is harder to correct because the causes are typically multiple, subtle, and interacting. It requires statistical process control and design of experiments to isolate and mitigate the noise.
The third category is the worst case: the process is both off-target and highly variable. This combined failure mode is where most real-world manufacturing operations actually operate on a daily basis. The accumulated Taguchi Loss in this scenario is massive, bleeding margin through rework, customer dissatisfaction, and inefficiency, even if the final first-pass yield metric looks acceptable.
Robust Design and Insensitivity to Noise
Taguchi did not just diagnose the financial loss; he prescribed an engineering method called robust parameter design. The core idea is to design the product and process so that normal variation does not matter. Instead of tightening tolerances, which increases manufacturing cost exponentially, you make the output insensitive to the noise factors you cannot control.
This methodology relies on orthogonal arrays, borrowed from Ronald Fisher’s design of experiments work. Orthogonal arrays allow engineers to systematically test combinations of factors with a fraction of the runs required by full factorial experiments. Taguchi classified variables into control factors that engineers can set, noise factors that cannot be easily controlled, and signal factors that determine the intended output.
You don’t eliminate the noise; you make the system deaf to it.
Engineers evaluate these experiments using signal-to-noise (S/N) ratios. Borrowed from electrical engineering, the S/N ratio captures both the mean output and the variability in a single metric. By analyzing S/N ratios, engineers identify the specific combination of control factor settings that maximizes robustness, keeping the output on target despite the presence of uncontrollable noise on the factory floor.
Taguchi Robust Design Sequence
- 01Identify factorsSeparate control factors from uncontrollable noise factors on the line.
- 02Select orthogonal arrayChoose the fractional factorial matrix that fits the number of variables.
- 03Conduct experimentsRun the trials, exposing the process to deliberately induced noise.
- 04Analyse S/N ratiosCalculate signal-to-noise values to find the most robust settings.
- 05Validate optimal settingsConfirm the new parameters in production and update control plans.
Calculating Loss on the Floor
Consider a facility machining shafts with a target diameter of 25.000 mm and specification limits of plus or minus 0.050 mm. The cost of scrapping a shaft that falls outside the specification is $12. Using the Taguchi formula, we set the loss at the specification limit to equal the scrap cost. The constant k calculates to $4,800.
With k established, every deviation from target gets a dollar value. A shaft that is 0.030 mm off target is still comfortably in spec, but it has already accumulated $4.32 of hidden loss. If the process produces 50,000 shafts a year with a standard deviation of 0.025 mm centered on the mean, the annual Taguchi Loss calculates to $150,000. Every single part passed inspection.
This mathematical reality is why I drive QA departments to adopt Taguchi principles over conventional compliance models. If you reduce the standard deviation from 0.025 mm to 0.015 mm through robust design, the annual Taguchi Loss drops to $54,000. That is a $96,000 cost reduction achieved without adding a single inspection step or tightening a single tolerance limit.
Traditional Compliance vs. Taguchi Quality
Traditional QC mindset
- Loss is zero as long as parts meet minimum specification limits.
- Primary defense is end-of-line inspection and sorting.
- Variability is acceptable if the process capability index is met.
- Tolerances are tightened in a bid to force higher quality.
Taguchi robust approach
- Loss increases quadratically with every millimeter of drift from target.
- Quality is engineered in during the design of the process.
- Variability is always harmful and treated as a financial cost.
- Process settings are tuned to make the output immune to noise.
Operational Failures and Implementation
The most common operational failure is treating in spec as the finish line. Management celebrates high first-pass yield while the Taguchi Loss embedded in those marginal parts remains invisible. The loss only surfaces months later as customer complaints and warranty claims. By then, the connection to the original process variability is lost, and the organization treats the symptoms instead of the cause.
Production reports often compound this error by focusing on averages. A process with a mean perfectly on target but a wide standard deviation generates a far higher Taguchi Loss than a process with a slightly shifted mean but extremely tight variability. The first scenario looks better on the daily report. The second scenario is substantially better for the customer and the bottom line.
To begin implementing the Taguchi framework, calculate the loss constant for your critical-to-quality characteristics. Identify your target values, spec limits, and scrap costs, and compute k. Suddenly, every measurement on your statistical process control chart has a direct financial impact attached to it. Prioritize the characteristics with the highest monetary loss and apply robust design experiments to reduce their specific variability.