
You bought the flip-chart paper. You gathered the team in a conference room for three days. A consultant walked everyone through the current state with sticky notes and coloured markers. The future-state map looked excellent — the redesigned flow, the kaizen bursts, the dramatically reduced lead time box at the bottom.
Then the poster went on the wall. And there it stays, faded and curled at the edges, while the process it documents continues exactly as before.
This is the reality of Value Stream Mapping (VSM) in most manufacturing organisations. A powerful diagnostic tool becomes a decorative exercise. The act of mapping replaces the act of improving. The waste you carefully documented continues right on schedule, every single shift.
What VSM Was Always Meant to Be
Developed within Toyota's production system as material and information flow mapping, VSM was never a standalone workshop activity. It was a working document. A production engineer or manager would walk the floor with it, pencil in hand, updating in real time as they observed actual material movement, actual information signals, and actual cycle times. The map was a snapshot of reality, and its only purpose was to reveal where flow broke down so you could fix it.
The method entered Western manufacturing through Mike Rother and John Shook's Learning to See in 1999. The book codified the now-familiar icon set — process boxes, inventory triangles, push arrows, pull loops, data boxes, and the timeline. It gave consultants a standard methodology to teach.
VSM became the entry point for almost every lean transformation. The logic is sound: before you attack waste, you must see it; before you redesign flow, you must map it. The execution is where everything falls apart.
The Anatomy of a Current-State Map
A proper current-state VSM captures three flows simultaneously: material (how product moves through each step), information (how each step knows what to make next), and time (processing duration versus queue duration). The data boxes underneath each process box must contain real, measured values — not estimates, not engineering standards, not last year's numbers.
Here is where most maps start to lie.
| Data Box Field | What People Put | What Toyota Actually Used |
|---|---|---|
| Cycle time (C/T) | Nameplate cycle time from machine spec | Timed average of 30+ consecutive cycles |
| Changeover time | Estimate from the operator | Observed changeover including adjustment losses |
| Uptime | Assumed percentage that sounds reasonable | Calculated from actual available time minus downtime |
| EPE (Every Part Every) | Verbal claim of run frequency | Actual production run pattern based on demand |
| Operators | Headcount per the org chart | Actual people on the line during the observed shift |
| Scrap rate | Annual average from quality reports | Current shift data, measured at the step |
When the data boxes contain approximations, the map becomes fiction. When the team builds a future state on fictional current-state data, the improvement plan is built on guesswork. Nobody goes back to verify because the map already looks credible — it has boxes, arrows, and numbers. But the numbers are guesses dressed up as data.
Walking the Floor: The Step Most Teams Skip
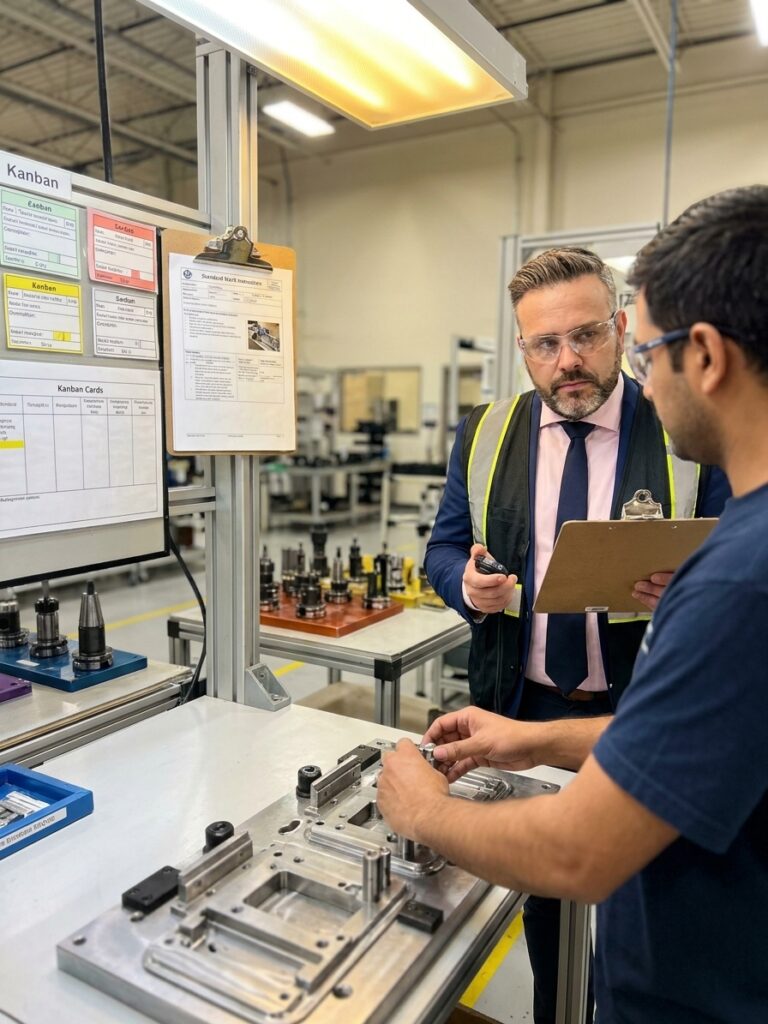
The most critical phase of VSM is the gemba walk — physically following the product from raw material receipt through every process step to finished goods shipment. Not a walkthrough. Not a guided tour by the plant manager who points at equipment and narrates. A deliberate, slow, observation-intensive walk where the mapper stands at each step with a stopwatch.
- Time cycles with a stopwatch across 30+ consecutive pieces
- Count work in process between every step, including overflow and staging
- Identify the actual information trigger for each step — schedule, kanban, or push
- Note defects, rework loops, and non-value-added handling
- Record actual shift patterns, breaks, and changeover frequency
In practice, the facilitator schedules a two-hour plant tour, walks the route with three managers, takes photographs, and returns to the conference room to draft the map from memory and opinion. Operators are interviewed briefly, if at all. The resulting current state reflects what management believes happens on the floor, not what actually happens.
I have seen maps where the documented cycle time was off by 40% from reality. I have seen inventory levels underestimated by a factor of three because the mapping team counted only what was visible at the work cell and missed the staging areas, overflow racks, and off-line buffer stock. I have seen information flows drawn as kanban pulls when the actual signal was a Monday morning production meeting and a printed spreadsheet.
If you have not walked the floor with a stopwatch, your current-state map is an assumption, not an observation.
Designing the Future State
The future-state map is where VSM delivers value or loses all credibility. The goal is to identify specific improvements that reduce lead time, eliminate identified waste, and create smoother flow. Each improvement should appear as a kaizen burst on the map, with an associated action, owner, and timeline.
Designing a Future State That Can Be Built
- 01Establish continuous flowConnect process steps directly without inventory, based on takt time and available capacity
- 02Define supermarket pullWhere cycle time mismatch prevents flow, install managed buffers with pull signals
- 03Set the pacemaker processChoose the single step that sets production rhythm for everything downstream
- 04Level the production mixSequence products at the pacemaker to smooth demand upstream
- 05Launch targeted kaizenExecute SMED, cell design, mistake-proofing, or TPM to make the future state feasible
Each kaizen burst must be specific enough that someone can act on it. "Improve changeover at press #3 from 45 minutes to under 10 minutes using SMED" is actionable. "Optimise the pressing operation" is wishful thinking in a rectangle.
Where the future state falls apart is when teams treat it as a vision board rather than a commitment. No owner is assigned. No date is set. No resource is allocated. The kaizen bursts look impressive on paper but translate into zero changes on the floor.
The Implementation Gap
I have observed the same pattern across dozens of organisations. Weeks one and two: high energy, the workshop generates excitement, management praises the analysis. Weeks three and four: the plan is typed up, a meeting is scheduled, some owners send delegates who have no context.
Weeks five through eight: a few quick wins get implemented — usually 5S cleanup, a kanban board, a relocated rack. The headline improvements, the ones that would actually reduce lead time, require capital expenditure, engineering support, or schedule changes nobody has authority to approve.
The maps that produce results get coffee-stained and revised. The maps that produce nothing get laminated.
By week twelve, the plan stalls. A new priority emerges — a customer audit, a product launch, a cost-reduction mandate — and the VSM initiative fades. Six months later, a new consultant arrives, suggests a fresh workshop, and the cycle repeats with a new poster.
Breaking the Cycle: What Actually Works
The organisations where VSM produces real results share characteristics that have nothing to do with mapping technique and everything to do with organisational discipline. Start with one product family, not the whole plant. Pick a family with five to eight process steps, clear customer demand, and visible waste. Prove the methodology on a focused scope before expanding.
Map on the factory floor, in pencil, with the people who work in the process every day. Conference-room mapping with managers who have not run a machine in years produces clean maps that miss everything that matters.
Assign a value stream owner with real authority — not a project manager, but the person accountable for the value stream's performance. This person needs authority over scheduling, staffing decisions at the involved cells, and direct access to engineering and maintenance support.
Implement in 90-day cycles with two or three specific kaizen actions per segment. At the end of each cycle, review progress, update the map to reflect the new current state, and plan the next segment. This keeps the map alive — it changes as the process changes, which is exactly what Toyota did.
The Lead Time Metric: The Number That Matters
The single most important output of a VSM exercise is the lead time ladder — the timeline at the bottom of the map that separates processing time from wait time. In most manufacturing operations, the ratio is staggering. Processing time, the time actually adding value, is typically 1-5% of total lead time. Wait time, inventory sitting between operations, accounts for the remaining 95-99%.
The Lead Time Reality in Most Plants
A plant with 30 days of total lead time usually has less than 8 hours of actual processing. The rest is inventory — waiting for machines, waiting for operators, waiting for decisions, waiting for transport, waiting for quality approval.
VSM makes this waste visible. That visibility is the method's greatest strength. But visibility without action is just documentation of failure. Every day the future-state plan sits unimplemented, those inventory dollars remain tied up, those customer promises remain vulnerable, and those process bottlenecks remain unbroken.
When VSM Is the Wrong Tool
Not every problem requires a value stream map. VSM is a flow optimisation tool. It reveals waste in material and information flow and helps you redesign for shorter lead times. It does not solve every manufacturing problem, and pulling it out for every initiative dilutes its impact.
Quality problems at a single process step require Pareto analysis and root cause investigation. Equipment reliability issues require TPM and predictive maintenance. Supplier delivery performance requires supplier development, not internal mapping. New product introduction complexity requires APQP and design-for-manufacturing. Organisational culture problems require structured change management, not a mapping workshop. Match the method to the problem.
The Test Before You Start
Before scheduling your next VSM workshop, answer these questions honestly. Have you identified a specific product family with a defined customer? Will the value stream owner participate in the mapping personally? Are operators from each process step available for the floor walk? Do you have authority to implement at least some changes within 30 days? Is there a mechanism to track lead time before and after? Has anyone committed to updating the map after each implementation cycle?
If you answered no to two or more of these, postpone the workshop until you can answer yes. A VSM done poorly does more harm than one not done at all — it consumes resources, raises expectations, and creates another artefact of improvement theatre. If your VSM is laminated, you have already failed.