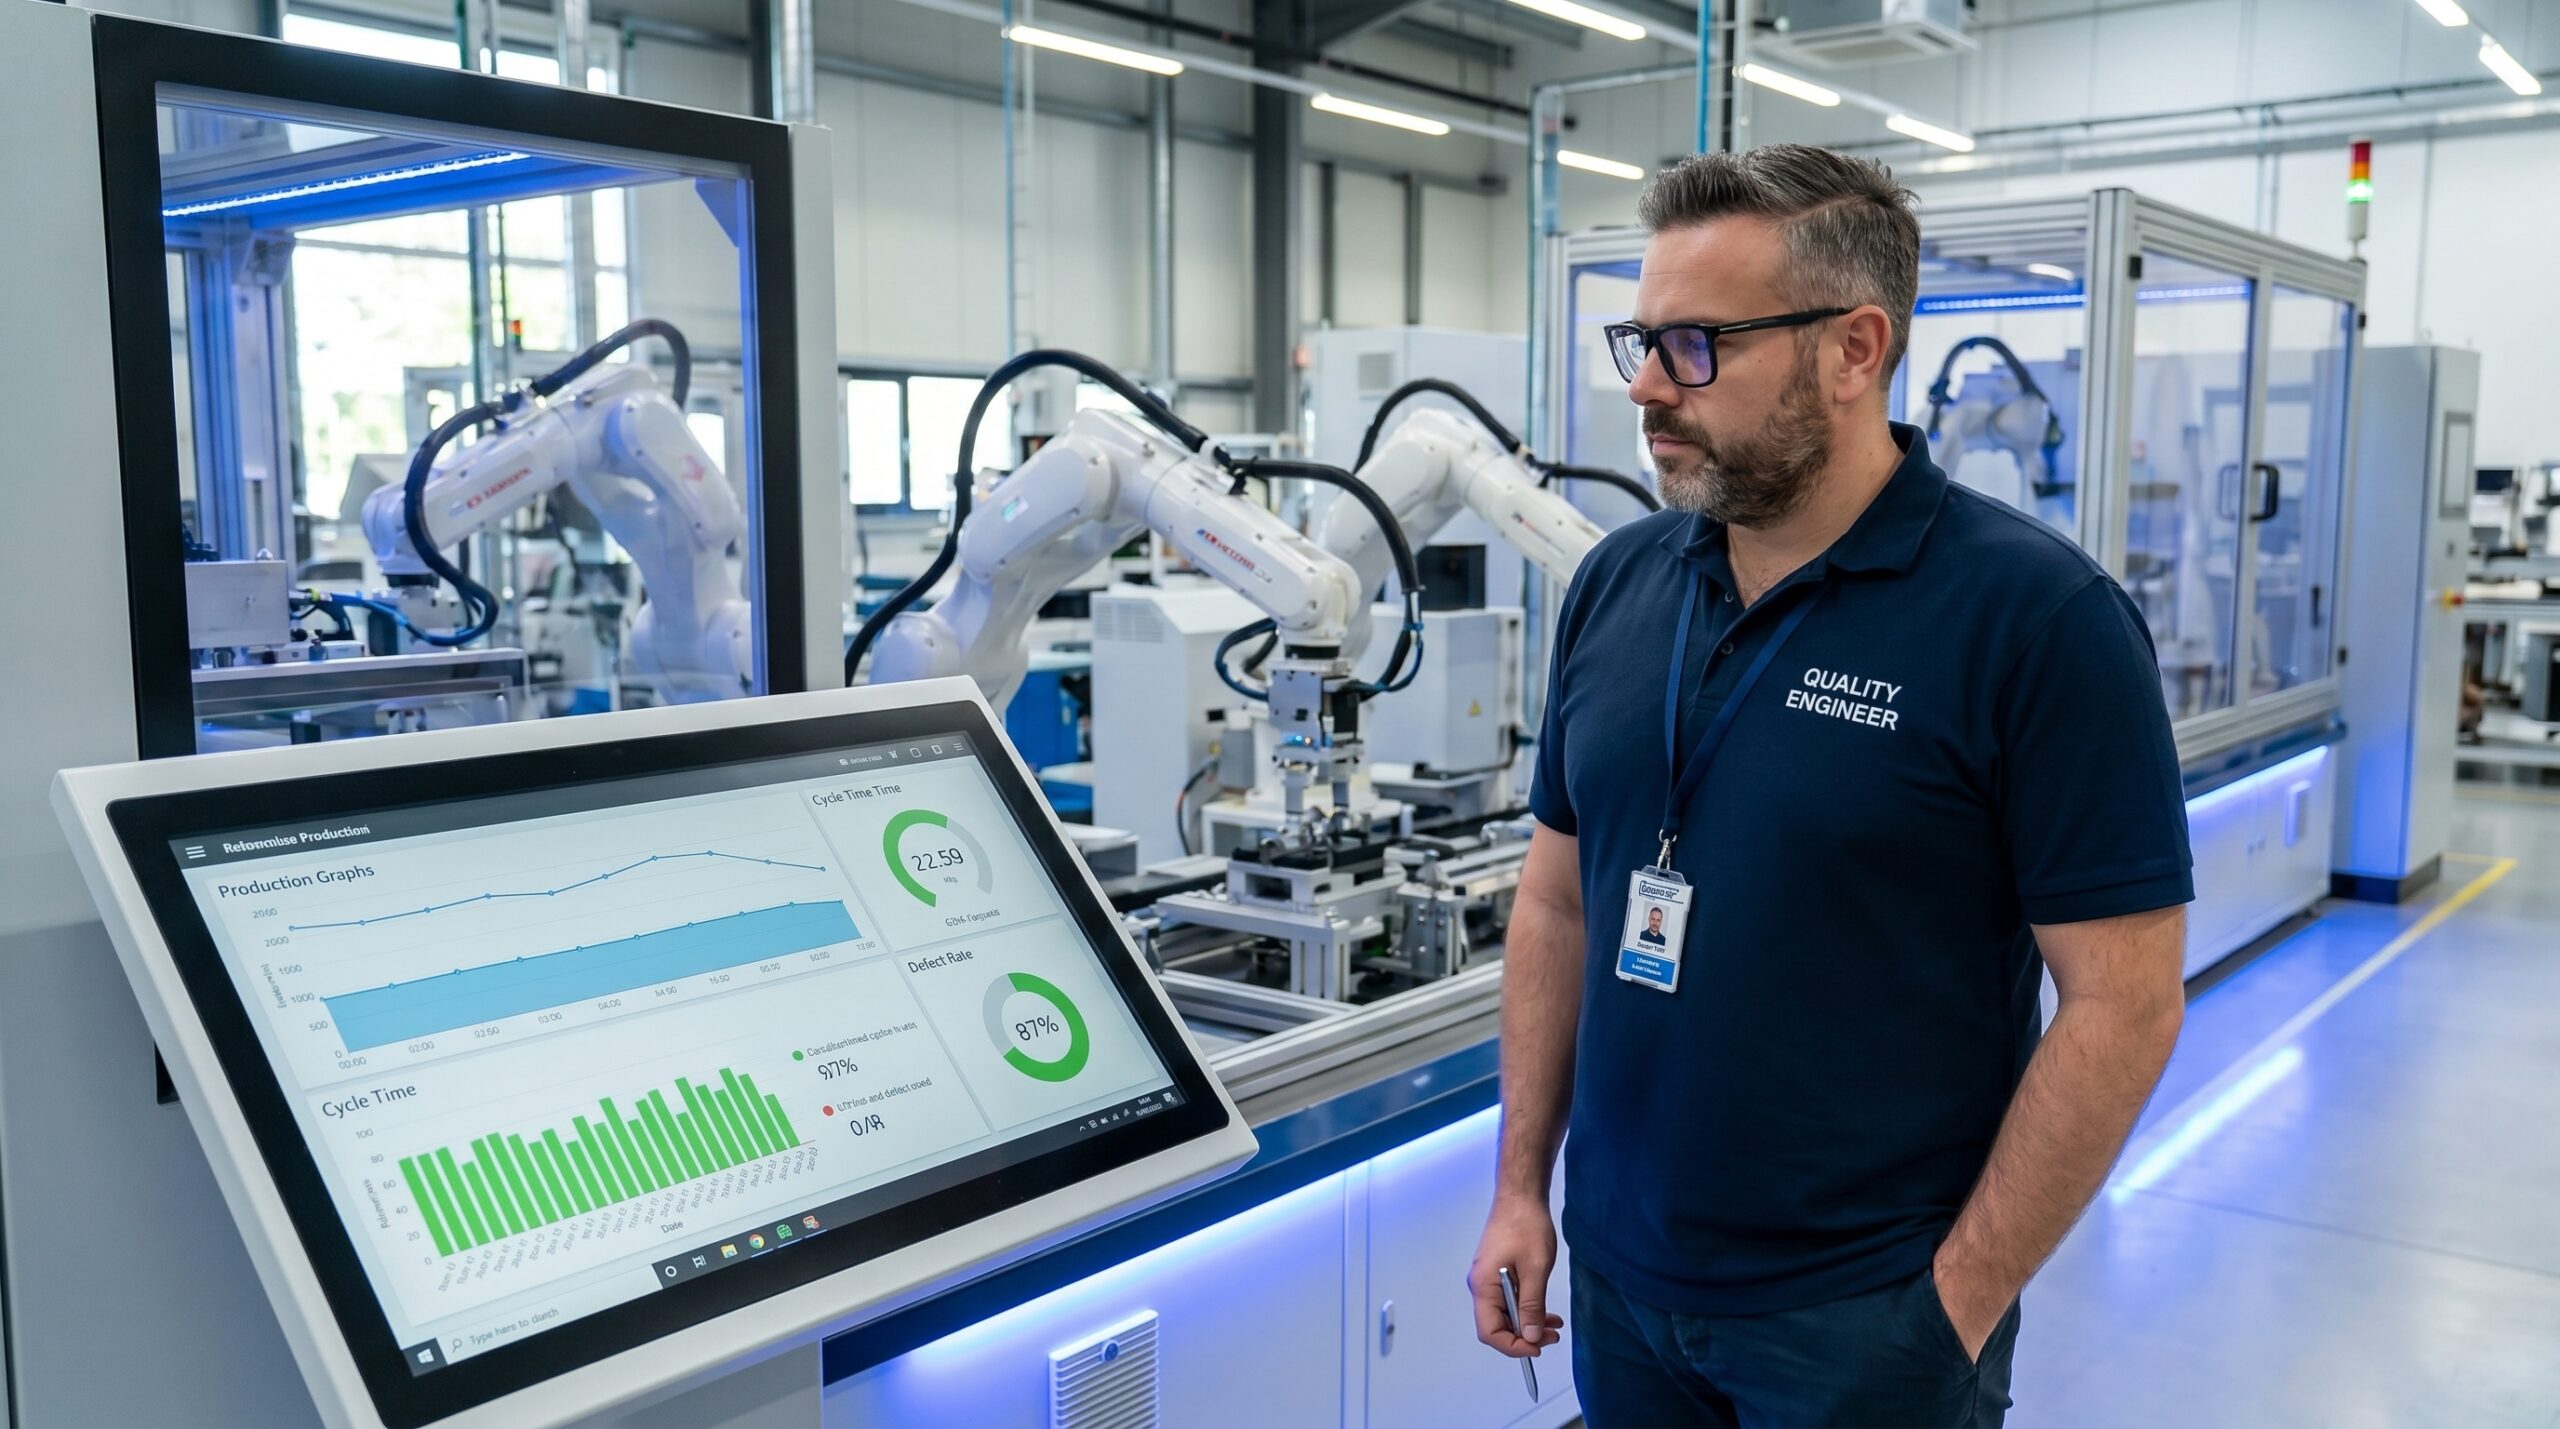
Walk the production floor at mid-morning. The machines are running, operators are working, and the Andon board glows green. The OEE dashboard reports a healthy 82%, so you return to your office confident in the line's performance.
What you did not see is the performance leakage. Between shift start and mid-morning, one press station likely stopped over four hundred times. Each event lasted between two and eight seconds—too brief for the operator to notice and entirely ignored by the monitoring system.
These are micro-stops: high-frequency interruptions that fall below the detection threshold of standard SCADA and OEE configurations. I have audited plants where micro-stops consumed between 8% and 18% of total available production time. This hidden capacity loss is a direct drain on throughput and a catalyst for latent quality defects.
The Mechanism of Invisible Loss
A micro-stop is any brief, repetitive interruption that falls below the detection threshold of your monitoring systems. It is not a breakdown, and your maintenance team will not recognise it from a work order. It is a process hiccup where a machine hesitates, a sensor retries, or a fixture jams momentarily.
Individually, a three-second pause is trivial. The danger lies in the pattern. Micro-stops repeat hundreds or thousands of times per shift, accumulating into massive losses. When a station pauses four thousand times across a shift, the cumulative time often exceeds the duration of a major breakdown.
Because these events are brief, plants tolerate them. Management rarely measures them. I have seen facilities purchase new equipment to increase throughput while their existing machines sat idle for hours a day, quietly pausing six thousand times per shift.

Where Micro-Stops Hide in the Process
Micro-stops are endemic to automated and semi-automated processes. On assembly lines, pick-and-place grippers frequently fail to achieve a perfect grip on the first attempt. The robot retries, adding nearly two seconds to the programmed cycle. Because the defect rate is low and the delay is minor, it remains unreported.
In stamping operations, parts occasionally fail to eject cleanly. The sensor detects a part-in-die condition and delays the next stroke by three seconds. The operator taps the die with a brass rod to clear it, normalising the delay into their working rhythm. Nobody logs the intervention because it feels routine.
Packaging lines experience similar losses when cartons fail to open or labels misalign. The reject mechanism cycles, halting the line momentarily. Hundreds of these brief rejects accumulate across a shift, generating a pile of untracked scrap and consuming significant production time.
CNC machining centres suffer from prolonged tool changes. If a magazine sticks slightly, a four-second tool change extends to six seconds. Multiplied across three hundred changes per shift on fifteen machines, that variance burns over ninety minutes of spindle time daily.
Why Standard Monitoring Fails
Most plants invest heavily in OEE trackers and Andon displays. These systems capture exactly what they are configured to capture. The problem is that standard configurations are blind to high-frequency, short-duration events.
Threshold settings are the primary culprit. Most OEE systems have a configurable minimum stop duration, typically defaulted to sixty seconds. Anything shorter is either ignored or lumped into a generic 'minor stops' category that obscures the actual frequency and root cause.
Cycle time averaging compounds the issue. If the standard cycle is twenty-four seconds and the actual average is 24.8 seconds, the variance looks like a rounding error. Multiplied by thousands of cycles, that eight-tenths of a second hides nearly an hour of lost production time inside a trivial decimal.
Operator normalisation masks the remainder. Human beings adapt to chronic delays. When a machine micro-stops several times an hour, operators adjust their rhythm. They do not report the issue because the disruption has become their definition of normal work.
The most dangerous production losses exist below the organisation’s sensory threshold, hidden by data averaging.
The Direct Impact on Quality
Micro-stops are frequently framed purely as an OEE or productivity issue. They are equally a critical quality risk. Every brief interruption disrupts the process rhythm, which is a primary driver of consistent quality output in automated manufacturing.
When a machine pauses and restarts, thermal equilibrium shifts and lubrication films break. Positional repeatability degrades by microns. The process is no longer in a steady state; it enters a perpetual cycle of starting and stopping, producing subtle variations in product characteristics.
These stops often cause parameter variations that fall well within acceptable limits but affect downstream performance. A plastic injection moulding machine that micro-stops produces parts with subtly different crystalline structures due to altered residence time. The parts pass dimensional inspection but fail in the field months later.
Furthermore, persistent micro-stops drive operator workaround defects. When operators adapt to chronic hesitations, they develop informal fixes—tapping, nudging, or skipping steps. Each workaround is a deviation from standard work and introduces uncontrolled variation into the process.
| Metric | Standard OEE Dashboard | Cycle-Level Reality |
|---|---|---|
| Availability | 91% (Reported) | 79.3% (Actual) |
| Minor Stop Allocation | 2.3% | 11.7% Hidden Loss |
| Detection Trigger | Stops > 60 seconds | Stops > 2 seconds |
| Financial Impact | Invisible | $2.3M Lost Revenue |
Systematic Detection and Data Capture
Detecting micro-stops requires deliberately lowering your detection threshold. Modern PLCs and CNC controllers record cycle-level data that rarely reaches the OEE dashboard. You must enable high-frequency logging for critical stations, capturing timestamps and error codes for every cycle rather than aggregated averages.
With high-frequency data available, stop looking at averages. Build a cycle time distribution. Plot a histogram of individual cycle times over a full shift. A healthy process shows a tight, normal distribution centered on the designed cycle time.
A process suffering from micro-stops shows a bimodal distribution. You will see a main peak at the normal cycle time and a secondary peak or long tail at the extended cycle time. That secondary peak is your micro-stop signature.
Finally, pattern analysis is critical. Determine if the stops are random or cyclical. Check if they correlate with specific products, tools, or environmental conditions. A Pareto analysis of micro-stop frequency by station will typically reveal that a small number of root causes drive the majority of the interruptions.
Micro-Stop Hunting Methodology
- 01Enable Data CaptureLog timestamps and error codes at the individual cycle level.
- 02Map DistributionPlot cycle time histograms to locate bimodal tails.
- 03Analyse PatternsUse Pareto analysis to isolate triggers by station and product.
- 04Gemba ObservationVerify sensor data against physical observation at the station.
Eliminating Micro-Stops at the Source
Once quantified, resolving micro-stops follows standard 8D problem-solving methodology. Mechanical causes are the most common root cause. Sticking slides, worn bushings, and misadjusted sensors are straightforward to fix, yet too minor to trigger a work order in a reactive maintenance environment.
The solution is to treat chronic micro-stops as a maintenance priority equal to a breakdown. Add micro-stop frequency to your preventive maintenance triggers. If a station exceeds its threshold, generate an automated work order before the equipment degrades further.
Programming causes also require scrutiny. Many micro-stops are literally coded into the machine. PLC logic often includes unnecessary confirmation waits or debounce delays added during commissioning to solve a problem that no longer exists. Reviewing PLC timers systematically yields significant cycle time improvement with zero hardware changes.
Finally, investigate material causes. Components running at the extreme edges of dimensional tolerance can cause feeding and seating issues that manifest as micro-stops. Tightening component tolerances at the source—or adjusting fixture acceptance—can eliminate thousands of micro-stops per shift.