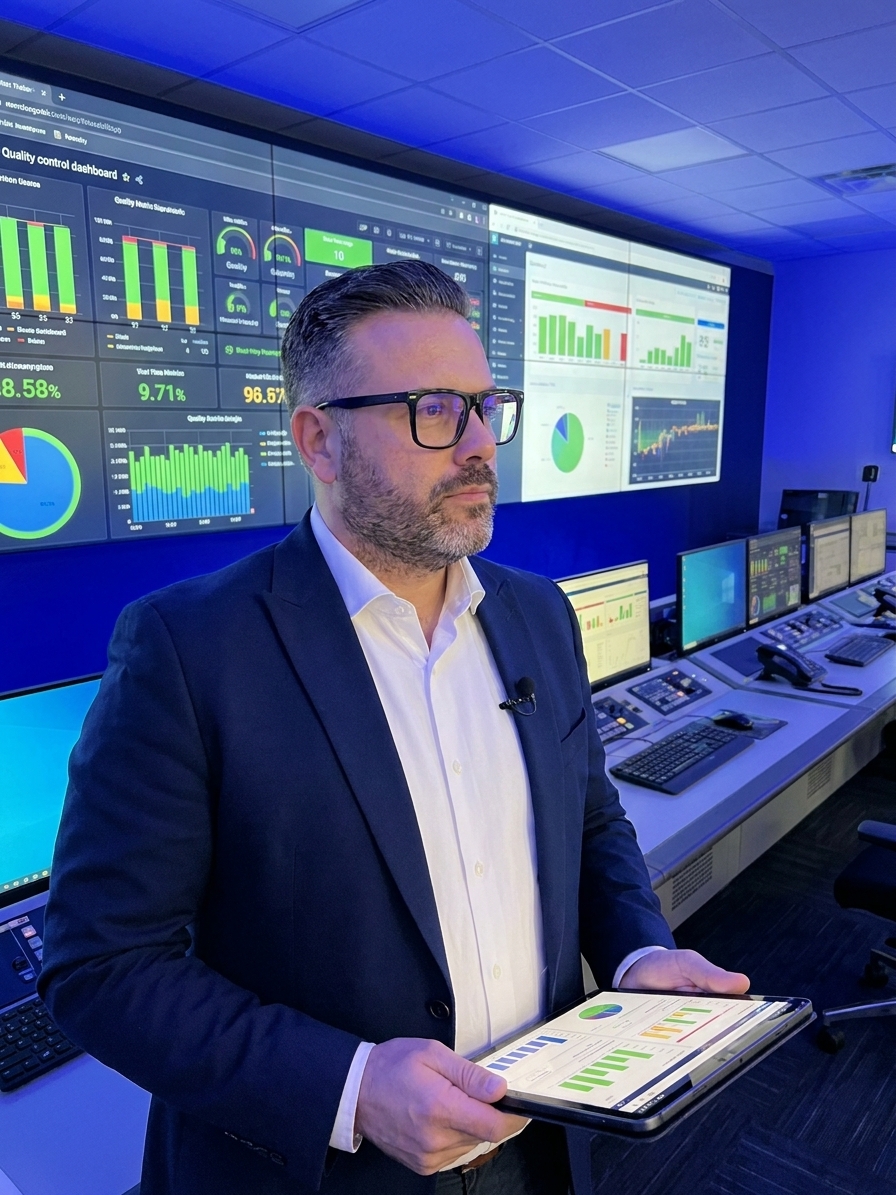
A quality dashboard shows 99.7% on-time delivery, a defect rate at 0.3%, and a customer satisfaction score holding steady at 4.2 out of 5. By every metric the executive team tracks, the manufacturing system is performing within tolerance. The aggregate data confirms the IATF 16949 QMS is functioning as designed.
Then a formal complaint arrives from an automotive Tier 1 supplier. Over eighteen months, this single customer received three mislabeled shipments, two late deliveries, and one batch with dimensional non-conformances that shut down their assembly line for fourteen hours. Their 8D corrective action request went unanswered for forty-seven days.
The quality manager pulls up the dashboards and verifies the math. Every number on the screen is accurate. The averages are real. But for this specific customer, the experience has been catastrophic. Nobody saw it because the mathematics of aggregate metrics are structurally designed to hide individual paths.
This is the ergodicity problem in quality management. Most organizations do not know it exists, and it is the reason facilities with impressive OEE and Cpk targets still lose critical accounts to cascading, unmonitored failures.
What Ergodicity Means in Quality Systems
An ergodic system is one where the average experience of a large group over a short period equals the average experience of a single individual over a long period. If a thousand people each spin a roulette wheel once, the average outcome matches one person spinning it a thousand times. The ensemble average and the time average are identical.
Manufacturing quality is non-ergodic. The ensemble average tracks how the system performs across all customers, all production batches, and all shifts. But individual customers do not experience the aggregate. They experience the time average — what happens specifically to them across the lifespan of your commercial relationship.
Your 99.7% delivery performance means 99.7% of all shipments arrive on time. But the customer receiving three consecutive late shipments experiences 0% delivery performance. Their time average is disastrous. Your aggregate dashboard will never surface this reality because the mathematical framework is built to smooth it out.
In non-ergodic systems, the time average is what destroys supplier trust and triggers line downs. Tracking only the ensemble average gives leadership false confidence. You are measuring the wrong population for the risk that actually materialises.
Structural Drivers of Non-Ergodicity
Quality systems become non-ergodic through correlated failures. In truly random variation, one defect does not predict the next. In real manufacturing, failures cluster. A worn cutting tool produces consecutive defective parts. A misaligned welding fixture compromises every assembly until maintenance corrects it. The aggregate defect rate looks stable while individual paths experience concentrated bursts of non-conformance.
Path dependence compounds the issue. A supplier quality defect missed at incoming inspection propagates through machining, surfaces at final test, and reaches the customer. The next shipment from that same raw material batch carries the identical risk. The customer experiences a chain of dependent events, not a random sample of your overall defect rate.

Uneven distribution of failures seals the trap. Your worst-performing shift or production cell does not distribute defects evenly across the customer base. Routing logic, geographic logistics, and production scheduling concentrate risk. Specific customers get hit repeatedly, experiencing a reality that bears no resemblance to your plant-wide OEE or scrap rate.
Feedback loops accelerate deterioration. When a customer experiences a quality failure, they tighten incoming inspection. This slows your response time and changes production scheduling. The initial failure triggers operational changes that make subsequent failures more likely for that specific customer.
The Aggregate Insurance Illusion
Organisations treat aggregate metrics as insurance policies, believing an acceptable average rate protects everyone. This assumption fails catastrophically in regulated environments. A sterility assurance level of 10 to the power of minus 6 looks exceptional on paper. But a single bioburden excursion in a water system contaminates an entire batch. For the patients receiving those units, the failure rate is 100 percent.
The average did not protect them because it was not designed to. The average was designed to make the organisation feel safe while specific paths through the system carried unmitigated risk. This is why major quality disasters, from Takata airbags to specific Boeing 737 MAX non-conformances, looked acceptable on aggregate data right up until the failure cascaded.
These organisations were not ignoring data. They were tracking ensemble averages in a non-ergodic system and believing those averages described individual risk. They relied on PPAP documentation and Cpk studies that validated the process capability of the mean, while entirely ignoring the severity of the tail.
I have audited plants where the leadership team genuinely believed a 99% first-pass yield meant 99% of customers were satisfied. The mathematical reality is that a fraction of customers absorbed 80% of the defects due to routing and path dependence. Their experience was entirely different from the average.
Diagnostic Questions for the Ergodicity Gap
You do not need advanced statistics to find ergodicity gaps. You need to change the questions you ask during management review. Shift the focus from the aggregate population to individual trajectories.
Instead of tracking the average defect rate, identify the customer with the highest accumulated quality failures. Map their experience as a continuous timeline, not isolated 8D incidents. Look at the interval between their failures. If the failures cluster, you have a correlated path that the aggregate metric actively conceals.
Shifting from Aggregate to Trajectory Analysis
- 01Filter by Customer PathIsolate all quality events for a single customer over a rolling 12-month window.
- 02Map Event CorrelationDetermine if one failure (e.g., late delivery) directly triggered the next (e.g., expedited shipment with labelling errors).
- 03Identify ConcentrationCheck if defects from a specific line, tool, or shift disproportionately hit this customer.
- 04Calculate Conditional ProbabilityMeasure the likelihood that a second failure occurs within three shipments of the first.
Calculate the conditional probability of repeat failures. Ask: what is the likelihood that a customer experiencing one defect will experience another within the next three shipments? If the probability exceeds your baseline defect rate, your system is non-ergodic. The failures are correlated, and your averages are structurally misleading.
Instead of reviewing how many CAPAs were closed, evaluate how many customers sit below the survival threshold. A customer who experienced three quality events in six months is on a failing trajectory, even if they represent a fraction of a percent of your total shipment volume.
Building a Trajectory-Based QMS
You cannot make a manufacturing system fully ergodic. Real-world constraints guarantee that failures will cluster and paths will diverge. But you can build a quality system that detects and intervenes before a trajectory becomes an absorbing state — a point of no return like a permanent line-down event or a cancelled contract.
Decouple failure paths through targeted engineering. If a worn tool produces defects, every part run since the last good piece is compromised. Implement redundant inspection steps, diverse material sourcing, and production rotation that distributes risk. PFMEA actions should specifically target the decoupling of correlated failure modes, not just the reduction of their frequency.
The failure that destroys your reputation will not show up in your average. It will show up in one customer's experience.
Implement survival metrics alongside defect rates. Track the percentage of customers who have experienced zero quality failures over rolling 90-day and 365-day windows. This metric approximates the time average that individual customers actually experience, exposing deterioration that aggregate scrap and rework rates completely hide.
Metrics for Non-Ergodic Quality Tracking
Connecting the Failures
Consider the Bavarian automotive supplier scenario again. When management reconstructed the customer's experience as a continuous narrative, the isolated incidents became a single, correlated cascade. The dimensional non-conformances came from a tool that had worn past its replacement threshold because the schedule was based on piece count, not actual tool wear data.
The mislabeled packaging originated from a new operator trained without adequate work instructions. The late deliveries were a direct consequence of the labelling errors — each labelling failure triggered a containment action that delayed the next outbound shipment. The unanswered 8D request had fallen into a gap between two quality engineers.
Every single failure was structurally connected. Each defect increased the probability of the next. The customer's experience was not a random sample of the plant's overall 99.7% quality rate. It was a deterministic path through a degraded segment of the production system.
The corrective action was not to improve the aggregate average. The average was already excellent. The corrective action was to redesign the monitoring system so that no single customer could fall into a failure cascade without being detected, pulled out of the queue, and rescued.
Designing for the Tail
Most quality standards, from ISO 9001 to IATF 16949, are designed around acceptable average performance. But in a non-ergodic system, the tail is what destroys reputations, triggers recalls, and ends commercial relationships. Your QMS must include specific controls designed to limit the severity of the worst individual experience, not just maintain an acceptable mean.
Quality is not experienced in the aggregate. It is experienced one customer, one assembly, one shift at a time. The manufacturer receiving the defective lot does not experience your 99.8% quality rate. They experience a 100% failure rate. If they receive two defective lots, they do not experience a slightly lower average. They experience a betrayal of the supplier contract.
Organisations that understand ergodicity design their data systems differently. They track individual trajectories. They decouple correlated failure paths. They intervene before a customer's experience deteriorates below a survivable threshold. They ensure the absorbing states — permanent defection, catastrophic line-down, regulatory action — are actively prevented by tail-risk controls, not merely monitored by dashboards.