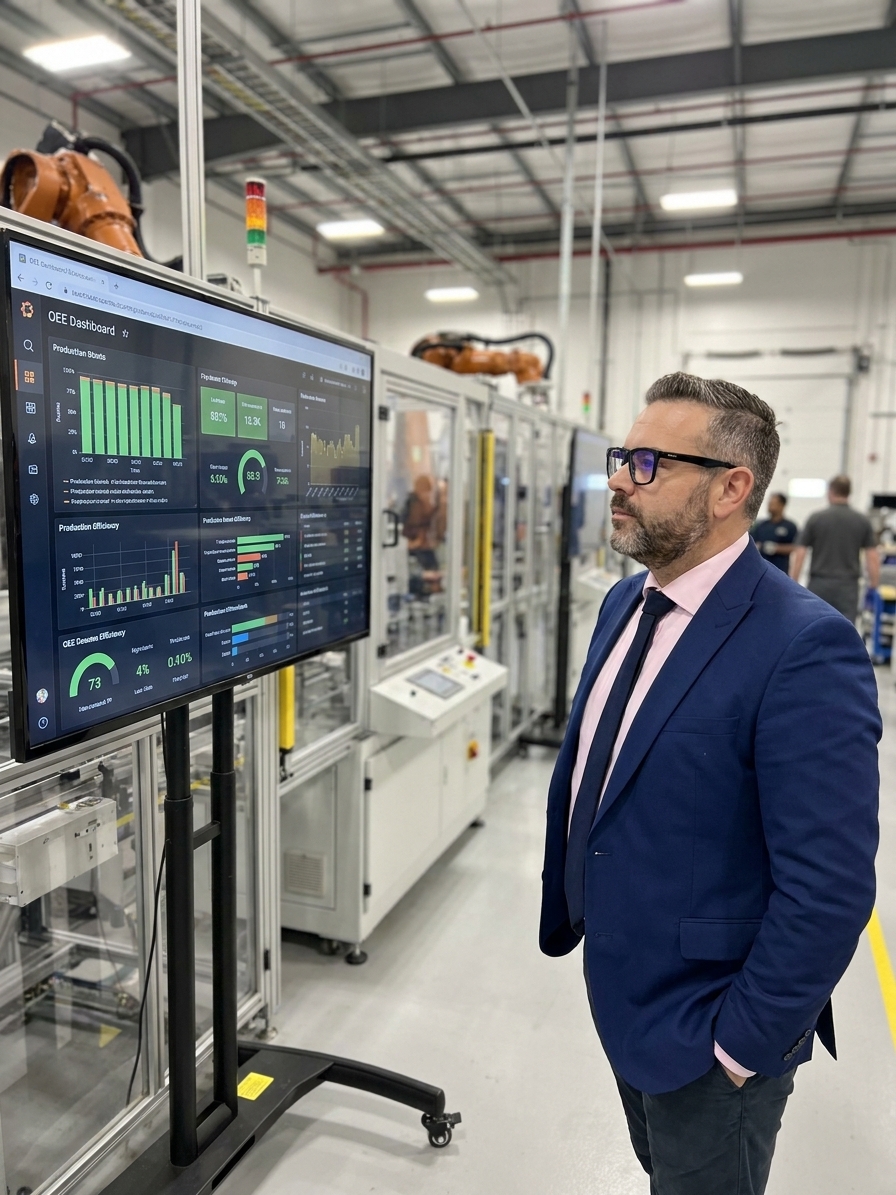
Overall Equipment Effectiveness is the most quoted metric in modern manufacturing. Walk into any plant operating under Lean or TPM principles and you will find it on a whiteboard, a dashboard, or a monthly report. Managers quote it in meetings. Consultants benchmark it. Board members ask for it by name. The formula is elegant in its simplicity: Availability multiplied by Performance multiplied by Quality.
Three numbers, each between zero and one, multiplied together to give a single percentage that is supposed to tell you how well your equipment is performing. Except it does not. Or rather, it tells you something, but not what you think it tells you, and not what you need to know to actually improve the process.
This is not an argument against OEE. The metric has genuine value when understood and applied correctly. But in the vast majority of manufacturing organisations I have audited, OEE has become a story people tell themselves about how well they are doing. It is often more fiction than fact, because the inputs are adjusted to produce a defensible number rather than an honest one.
The Availability Lie: Redefining Planned Time
Availability measures the proportion of scheduled time that your equipment is actually running. The formula is simple: Run Time divided by Planned Production Time. A machine scheduled for eight hours that ran for seven gives you 87.5% availability. The mathematics are not the problem. The problem begins with the definition of Planned Production Time.
Who decides what was planned? In many organisations, planned time is adjusted retroactively to account for unplanned downtime events. A machine goes down for two hours because of a mechanical failure, and someone decides that the maintenance should have been scheduled. The event gets reclassified as planned downtime. Planned production time shrinks by two hours, and availability stays artificially high.
This is not always dishonest. Sometimes it is a genuine disagreement about classification. A die change was supposed to take thirty minutes but took ninety. Was the extra hour unplanned downtime, or was the original estimate simply unrealistic? The answer depends on who you ask, and the person doing the asking is usually the person whose performance is being measured.
Then there is the question of what counts as running. A machine cycling but producing scrap is technically available. A machine running at reduced speed because of a worn component is available. A machine producing parts that will fail downstream inspection is available. Availability tells you the machine was powered on. It does not tell you it was doing anything useful.
The Performance Lie: Choosing Your Own Ideal
Performance measures how fast your equipment is running compared to how fast it could run. The formula is Actual Output divided by Theoretical Output at rated speed. If a machine could theoretically produce 100 parts per hour and produced 85, your performance rate is 85%. The theoretical rate is where the trouble starts.
What is the ideal cycle time of your equipment? The manufacturer's specification? The best cycle time achieved under laboratory conditions? The cycle time your industrial engineer calculated on paper? In practice, organisations choose the denominator that gives them the number they want. The same machine can yield dramatically different OEE values depending on which theoretical speed you choose, and both choices can be defended as reasonable.

There is also the matter of minor stops. A machine that pauses for three seconds every minute to clear a jam is not technically down. Each pause is too short to track individually. But over an eight-hour shift, those micro-stoppages accumulate to nearly forty minutes of lost production. Most OEE tracking systems do not capture these losses. They disappear into the performance rate as unexplained slippage.
The Quality Lie: Erasing Rework and Scrap
Quality is the most straightforward dimension: Good Parts divided by Total Parts Produced. But the definitional games are relentless here as well. What counts as a good part? Parts that pass final inspection? Parts that pass in-process checks? Parts that the customer accepts? Each definition produces a different quality rate, and each can be justified under the right internal logic.
Then there is the rework problem. If a part is produced out of specification and then reworked to meet specification, does it count as good or defective? In many OEE calculations, reworked parts are counted as good because they passed inspection eventually. This inflates the quality rate and understates the true cost of poor quality, because rework consumes labour, energy, time, and machine hours that the formula ignores.
Scrap that is recycled presents a similar ambiguity. If you melt down defective castings and pour them again, the raw material is recovered, but the energy, labour, and machine time are gone forever. OEE, in most implementations, treats the re-poured casting as a fresh part and the recycled scrap as though it never happened. A reworked part and a first-pass-good part are numerically identical.
The Multiplication Problem: Compounding Error
Even if you could solve all three definitional problems, and you cannot completely, there is a mathematical issue most OEE users ignore. When you multiply three numbers together, small errors in each component compound. A single percentage point of generous interpretation in availability, performance, and quality does not cost you one point in the final OEE. It costs you roughly three.
Consider a machine with reported availability of 92%, performance of 95%, and quality of 98%. The reported OEE is 85.7%, which looks like a solid number. But if availability is actually 88% due to reclassified downtime, performance is actually 90% due to an inflated ideal cycle time, and quality is actually 96% due to rework counting as good, the real OEE is 76.0%.
Reported vs. Actual OEE Calculation
That is the difference between a world-class operation and one that needs significant improvement. It is hidden inside what looks like a reasonable three-percentage-point error in each component. Over a year of production, that gap represents thousands of lost parts, hundreds of wasted hours, and substantial money that nobody accounts for because the dashboard says things are fine.
Goodhart's Law on the Factory Floor
The OEE literature commonly cites world-class performance as 85%: 90% availability, 95% performance, and 99.9% quality. This benchmark, derived from Seiichi Nakajima's work on TPM in the 1980s, was descriptive. It described what the best Japanese plants were achieving at the time. It was never intended to be prescriptive, and it was never intended to be a universal target.
OEE was a reasonable measure of equipment effectiveness. Then it became a target. Now it is neither.
But in the decades since, 85% has become a de facto standard. Organisations set it as a goal. Managers are evaluated against it. Plants that achieve it celebrate; plants that fall short are pressured to improve. The result is exactly what you would expect: people find ways to make the number say 85% without necessarily making the underlying reality any better.
Some organisations have made things worse by setting OEE targets above 85%. A target of 90% or 95% is not aspirational. It is mathematically hostile to honest reporting. When the target is that high, the only way to achieve it is to redefine the inputs. Ideal cycle times slow down. Downtime gets reclassified. Rework disappears from the quality count. The dashboard looks magnificent. The factory floor tells a different story.
Stop Averaging and Start Investigating
The most productive thing most manufacturing organisations could do with OEE is stop averaging it. Not stop calculating it. Stop averaging it. A single OEE number for a plant is an average of averages of averages. It tells you almost nothing about what is actually happening on the floor. The OEE of Machine 3 during the overnight shift running Product B is a meaningful number. The plant-wide average for March is not.
Instead of chasing an aggregate OEE target, track the three components independently at the equipment level with clear and unchanging definitions. Use them to identify specific losses. Which machine has the lowest availability? Which shift has the worst performance rate? Which product has the highest quality loss? These are actionable questions. How to get OEE to 85% is not an actionable question.
From Composite Metric to Actionable Loss
- 01Decompose the metricBreak OEE down by machine, shift, and product to find the outlier
- 02Isolate the componentIdentify whether availability, performance, or quality drove the loss
- 03Identify specific lossQuantify the exact failure mode: die change time, micro-stops, or scrap
- 04Apply corrective actionTarget the engineering or process issue directly, not the index
The best plants do not quote OEE numbers in meetings. They quote specific losses. They lost 340 minutes on the forming line last week to die changes, and 180 minutes to unplanned maintenance. The CNC cell scrapped 47 parts on Thursday, all from the same batch of material. They do not need a composite index to tell them where their problems are, because they have already looked at the components and identified the root causes.
The Real Cost of Metric Obsession
There is a cost to the way most organisations use OEE that goes beyond inaccurate numbers. The real cost is attention. Every hour a management team spends discussing how to improve OEE is an hour not spent discussing how to improve the specific things OEE is supposed to represent. If availability is the problem, the conversation should be about preventive maintenance schedules and changeover reduction.
If performance is the problem, the conversation should be about process engineering, tooling wear, and operator training. If quality is the problem, the conversation should be about process capability, incoming material inspection, and mistake-proofing. The conversation should never be about which ideal cycle time to use in the denominator or whether rework should be counted as good.
OEE, used properly, points you toward these conversations. OEE, used the way most organisations use it, replaces these conversations with arguments about the number itself. The metric becomes the meeting. The dashboard becomes the discussion. The target becomes the objective. And the actual quality, the actual productivity, and the actual performance of the equipment on the factory floor become secondary to the number that is supposed to represent them.
Measure OEE. Track it consistently. Use it to ask questions. But never treat it as the answer. The metric is not broken. The relationship with the metric is broken. Broken relationships with metrics produce broken understanding of reality, which produces broken decisions, which produce broken outcomes. Fix the relationship first.