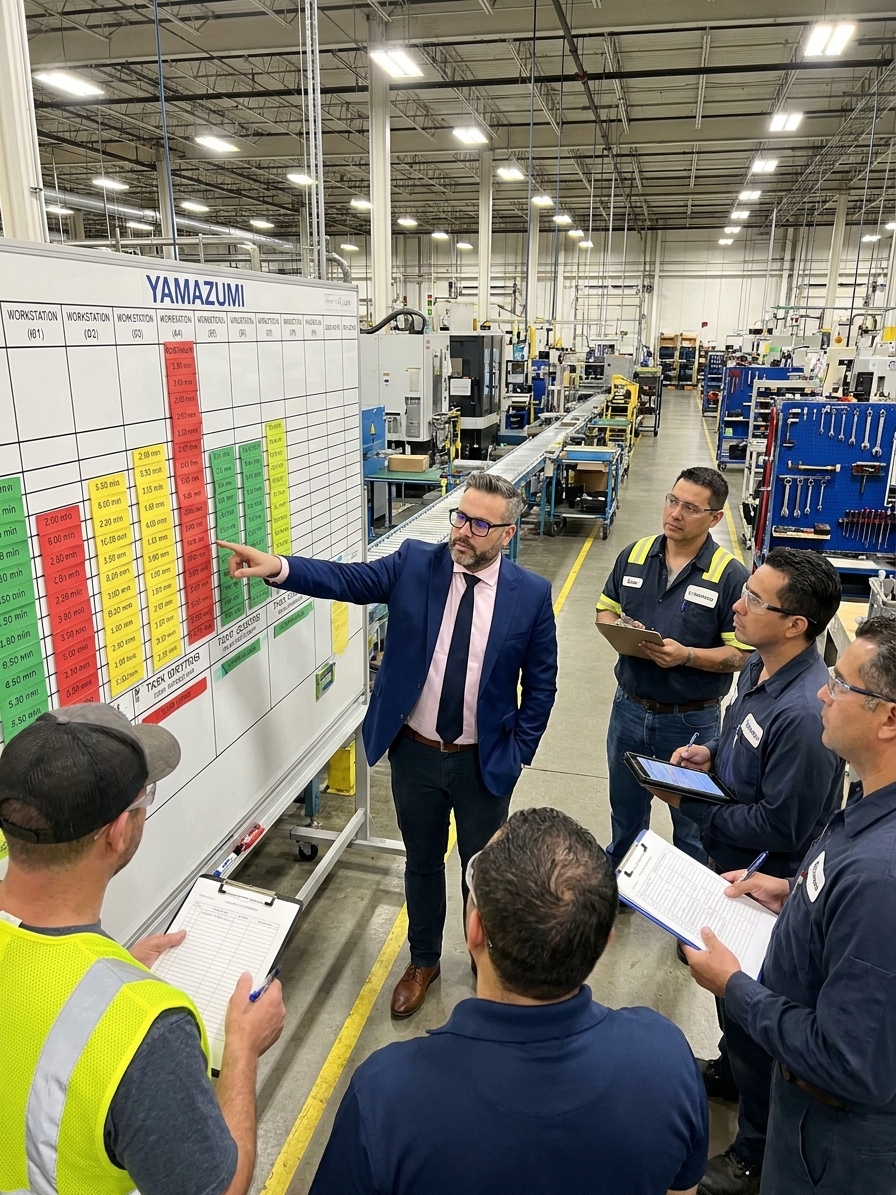
A Yamazumi board is a manual visualisation tool for line balancing, and its mechanics are simple. You take every task in a process, plot each on a coloured strip, and stack them vertically by workstation. The tallest stack is your bottleneck, governing the output of the entire line. The shortest stack is your wasted capacity. The unevenness between them is the mura you are supposed to eliminate.
A properly constructed board makes invisible waste visible in a single glance. It shows exactly where work piles up, where operators are drowning, and where stations sit idle. It is one of the most powerful diagnostic instruments in lean manufacturing because it requires no software or statistical training. It requires only operational honesty.
This is precisely where the tool fails in practice. I have audited plants that maintained pristine, colour-coded Yamazumi boards during a lean rollout, only to leave them frozen on a wall for three years. The tape peeled, the process changed entirely, but the board remained. It was presenting stale fiction as current fact, actively misleading managers who walked by and made decisions based on a defunct reality.
Building from Standards Instead of Reality
A Yamazumi board is only as accurate as the data underpinning it. The most common failure mode occurs when teams build boards from engineered time estimates rather than physical measurement. A supervisor reviews a process flowchart, writes down how long each step should take, and operators agree simply to end the meeting faster. The resulting board looks immaculate, but every number on it is fundamentally wrong.
Cycle times measured by stopwatch on the shop floor routinely differ from engineered standards. The reason is that documented standard operating procedures routinely omit micro-activities. Real work includes material handling, micro-stoppages, quality checks, walk time, and minor equipment adjustments. When you build a Yamazumi stack from a standard instead of direct observation, you are balancing a theoretical line that does not exist.
The consequence is false capacity planning. If the documented work content ignores the ten minutes per shift an operator spends locating a specific torque wrench, the station will artificially appear under-loaded. Production planning will schedule against the engineered rate, the station will fall behind, and the root cause will remain invisible because the board does not display it.
The Multi-Product Balancing Trap
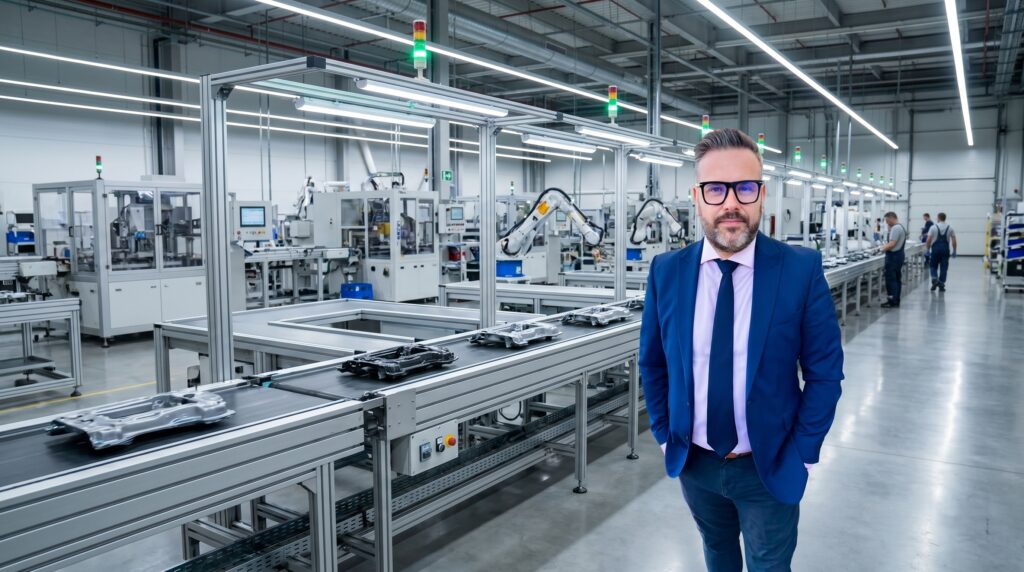
Manufacturing lines rarely produce a single SKU, yet many teams build their Yamazumi board for only one product variant. A team might balance a line beautifully, ensuring every station operates within five percent of takt time. However, if that balanced product accounts for only thirty percent of actual production volume, the board is operating as a partial truth.
The remaining seventy percent of production involves different task sequences, cycle times, and work distributions. A single-product Yamazumi board on a mixed-model line creates a dangerous illusion of control. It hides the reality that Station 4 might handle Product A perfectly but become a severe bottleneck when Product B introduces a complex assembly sequence.
To resolve this, the board must reflect the weighted average work content per station across the entire product family. If your facility runs a mixed-model line, you must build separate boards for your highest-volume and highest-complexity variants. Building a board for a single, idealised product is an exercise in fairy tales, not capacity planning.
Ignoring the Diagnostic Colour System
The red-yellow-green colour coding on a Yamazumi board is diagnostic, not decorative. Green strips represent value-added work. Yellow strips represent incidental but necessary work, such as loading fixtures or retrieving materials. Red strips represent pure waste, encompassing waiting, rework, searching for tools, and double-handling. When used correctly, the colour system immediately reveals what kind of problem each station faces.
Most teams ignore this system entirely. They use whatever sticky notes were in the supply closet, producing a monochrome board. This board displays column height but not composition. You can see that a station is overloaded, but you cannot differentiate between a true capacity constraint and a process design flaw that forces operators to perform unnecessary handling.
Monochrome vs. Coded Yamazumi Analysis
What teams do (Monochrome)
- Uses uniform sticky notes from supply closet
- Shows only total cycle time per station
- Identifies the bottleneck location accurately
- Leaves the improvement conversation one step behind
What works (Colour-coded)
- Classifies tasks as value-add, incidental, or pure waste
- Reveals hidden yellow handling tasks driving overloads
- Differentiates capacity constraints from process design flaws
- Targets specific waste streams for elimination immediately
The fix requires five extra minutes during construction. Colour the strips according to lean standards. Stations you initially classified as capacity-constrained are often drowning in yellow incidental work. By identifying this on the board, you can eliminate unnecessary handling without touching the green value-added content, immediately improving flow.
Failing to Move the Strips
The board is designed to be an interactive workspace, yet it almost never functions as one. During a kaizen event or a weekly improvement huddle, teams should physically rearrange the strips on the board. They should simulate line balance changes before moving physical work elements on the floor. In practice, people look at the board, agree on the bottleneck, end the meeting, and leave the strips exactly where they were.
This passive observation turns a diagnostic tool into a display. It is the equivalent of purchasing a PFMEA document, reading the risk priority numbers, and refusing to implement the recommended engineering controls. The analytical value of the board lies entirely in simulating alternatives.
Without physical interaction, the tallest column on the board becomes a permanent geographical feature. The team accepts it as immutable reality. This represents the total inversion of the tool's purpose. The board was designed to eliminate bottlenecks, not to catalogue them for management review.
Rebuilding a Dead Yamazumi Practice
If your boards have become wallpaper, you must revive them through a strict operational cadence. The first step is tearing down any board that has not been updated in the last ninety days. If the data is stale, the board is fiction. Starting entirely fresh is safer than attempting to correct decayed assumptions.
Next, conduct fresh time studies on the shop floor. Measure every task, every station, and every product variant using stopwatches. Record at least ten consecutive cycles per task to capture natural variation. The team must document the micro-activities missing from the standard operating procedures. Only from this verified data can you rebuild the stacks accurately.
A bottleneck that appears on your board in January and is still your tallest column in June has a management problem, not a process problem.
The Continuous Improvement Cycle
- 01Measure actual cyclesTime studies on the floor, capturing undocumented micro-activities
- 02Construct the boardBuild stacks using colour-coded strips reflecting weighted product mix
- 03Analyse and simulatePhysically move strips during kaizen events to test line balance
- 04Implement on the floorExecute the simulated changes to the physical workstations
- 05Measure and updateVerify cycle time improvements and recalculate stack heights
Once rebuilt, mount the board at the point of use. It belongs on the shop floor, near the line, where operators and team leaders interact with it daily. Establish a rigorous update schedule. Weekly reviews must note process changes and update strips immediately. Monthly cross-functional huddles must use the board to plan physical kaizen actions. Quarterly, conduct full board reconstructions from fresh time studies to prevent drift.
Tracking the Metrics That Matter
An effective Yamazumi practice requires tracking hard metrics to verify whether the board is driving improvement or merely decorating a wall. You must calculate the line balance ratio, determined by dividing the lowest station time by the highest station time. This metric provides a mathematical baseline for process evenness across the entire line.
Additionally, monitor the bottleneck cycle time trend and the percentage of red waste strips over time. If the tallest column on your board never shrinks, the visual management system has failed. Set a strict operational rule: no bottleneck station is allowed to remain the tallest column for more than one improvement cycle.
When the board identifies a constraint, that station becomes the priority for engineering, maintenance, and operator training resources until it is no longer the bottleneck. The board is then updated, the new constraint is identified, and the improvement cycle repeats. This is the practical application of the theory of constraints.
A Yamazumi board asks one relentless question: why is this stack taller than the others? If your organisation can answer that question honestly and act on it, the board is functioning as designed. If the team looks at the tallest stack and accepts it as permanent geography, the tool has failed. The board is only a mirror. The question was always whether management was willing to look at the waste it reflects and eliminate it.