
Overall Equipment Effectiveness (OEE) is the most widely adopted manufacturing metric in the world, and one of the most widely abused. Developed by Seiichi Nakajima in the 1960s as part of the Total Productive Maintenance (TPM) framework, it was designed to give operators and maintenance teams a shared, objective language for identifying equipment losses. It compresses three dimensions of loss into a single percentage. Clean, elegant, and in the wrong hands, dangerously misleading.
Nakajima never intended OEE for executive dashboards. He built it as a frontline diagnostic tool, a flashlight for finding waste in the dark corners of a process. Today, companies track it religiously, report it to boards of directors, and use it to justify capital investments worth millions. They achieve this while systematically undermining the data integrity that makes the metric meaningful in the first place. In most plants, OEE has stopped being a measurement and become a narrative.
The formula itself is simple: Availability multiplied by Performance multiplied by Quality. A world-class OEE is generally considered 85%, calculated as 90% availability, 95% performance, and 99.5% quality. Most factories operate between 40% and 60%. The gap between where they are and where they could be represents enormous lost productivity. Closing that gap requires absolute honesty about where the losses are, and that is precisely where the system breaks down.
Manipulating the Availability Baseline
The first sign of OEE dysfunction is usually in how Availability is calculated. The denominator, Planned Production Time, is the easiest variable to manipulate. If a machine was scheduled to run for sixteen hours but was down for eight, plant management faces uncomfortable questions. To avoid this, supervisors simply redefine the baseline. They exclude the downtime from the calculation entirely.
Planned maintenance gets removed. Changeovers are excluded. Material shortages are dismissed as external factors. Before long, a catastrophic 50% availability figure is artificially inflated to 90% because the baseline was redefined to make the output look acceptable. The number becomes technically defensible under internal definitions, but completely meaningless for making actual improvement decisions.
I have audited plants where the reported OEE was 92%, supposedly world-class by any standard. Yet walking the floor, the machines were visibly standing idle for a third of the shift. When I asked to see the calculation methodology, I was shown a spreadsheet with seventeen adjustments, exclusions, and caveats. The data had been engineered to hit a target rather than reflect reality. The metric was protecting the manager, not diagnosing the machine.
The Fiction of Nameplate Rates and Quality Exclusions
The manipulation extends into Performance measurement through the Nameplate Rate. This theoretical maximum speed is usually pulled from an OEM specification sheet printed when the machine was new, tested under ideal conditions. Some factories use this unverified rate as-is, meaning their performance metric is artificially low because the machine has never sustained that speed in production.
Other factories practice rate creep. They adjust the theoretical speed downward over time so the performance number stays above 95%. Each adjustment is small and individually justifiable by wear and tear. Together, they create a performance metric that tells you nothing about actual equipment capability or the degradation occurring on the floor.
Quality is the hardest number to fake, but it is not immune. The definition of rework dictates the outcome. I have seen automotive plants where rework was classified as normal production because the nonconforming parts were eventually shipped, just after a second pass through the line. The quality rate looked pristine, satisfying IATF 16949 expectations on paper, while the massive cost of running every part twice was buried in the standard cost.
| Metric | World-Class Target | Typical Factory Reality |
|---|---|---|
| Availability | 90.0% | 60 – 70% (Inflated by excluding changeovers) |
| Performance | 95.0% | 70 – 80% (Distorted by unverified nameplate rates) |
| Quality | 99.5% | 90 – 95% (Hidden rework classified as good production) |
| Total OEE | 85.0% | 40 – 60% (The actual baseline before adjustments) |
Cross-Industry Benchmarking is Useless
Once a plant has an OEE number, the next temptation is benchmarking. Consultants will happily sell the narrative that 85% is world-class and 60% is the industry average. If your factory reports 55%, you are told to invest heavily in improvement programs. This logic ignores operational reality. OEE benchmarks across different factories, industries, and equipment types are entirely useless without context.
An automated bottling line running a single product 24/7 can achieve 80% OEE with minimal effort. A job shop running fifty different parts on the same machine, with frequent changeovers and small batch sizes, would struggle to break 50%. That 50% might represent extraordinary operational performance given the constraints. Comparing the two is like comparing the fuel efficiency of a delivery truck and a Formula 1 car.
This does not stop corporations from setting blind targets. A mandate to achieve 75% OEE across all lines by Q4 is a classic example. Line A is high-speed and automated, where 75% is mediocre. Line B is a complex assembly cell where 75% is physically impossible without reducing product variety. Line C was already at 80% and is now pressured to maintain that number by any means necessary. The mandate becomes an incentive to manipulate the data.
The Organisational Damage of Gaming Metrics
When a metric becomes more important than the reality it represents, the behaviour it drives is destructive. Improvement resources are misallocated because the data points engineering teams toward the wrong problems. If your manipulated OEE says your biggest issue is quality when your actual issue is availability, your team will spend months optimising inspection processes while machines sit idle waiting for tooling.
Operators learn that data collection is theatre. When the people closest to the equipment watch managers manipulate definitions to hit targets, they learn the system is about protection, not improvement. When they see a bearing making noise or a cycle time drifting, they do not report it. They know nobody wants to hear it because it would lower the number. Small problems fester until they become catastrophic failures.
Maintenance becomes reactive. High availability numbers reduce the urgency for preventive maintenance work orders. Why schedule downtime for inspection when the numbers say everything is fine? Maintenance is deferred until a breakdown occurs, at which point the resulting downtime is excluded from the next month’s calculation as an exceptional event. The cycle of decay continues, hidden by dashboards.
The further a metric travels from the machine it describes, the more distorted it becomes, until it arrives as a number everyone respects and nobody believes.
The Cycle of Metric Decay
- 01Target MandateExecutive leadership sets an arbitrary OEE target without understanding the process constraints.
- 02Data AdjustmentFrontline management excludes changeovers and downtime to mathematically approach the target.
- 03Suppressed ReportingOperators stop reporting minor stops and equipment degradation to protect the manipulated metric.
- 04Catastrophic FailureHidden wear leads to major breakdowns, which are then excluded from the OEE calculation as exceptional events.
Rebuilding an Honest OEE System
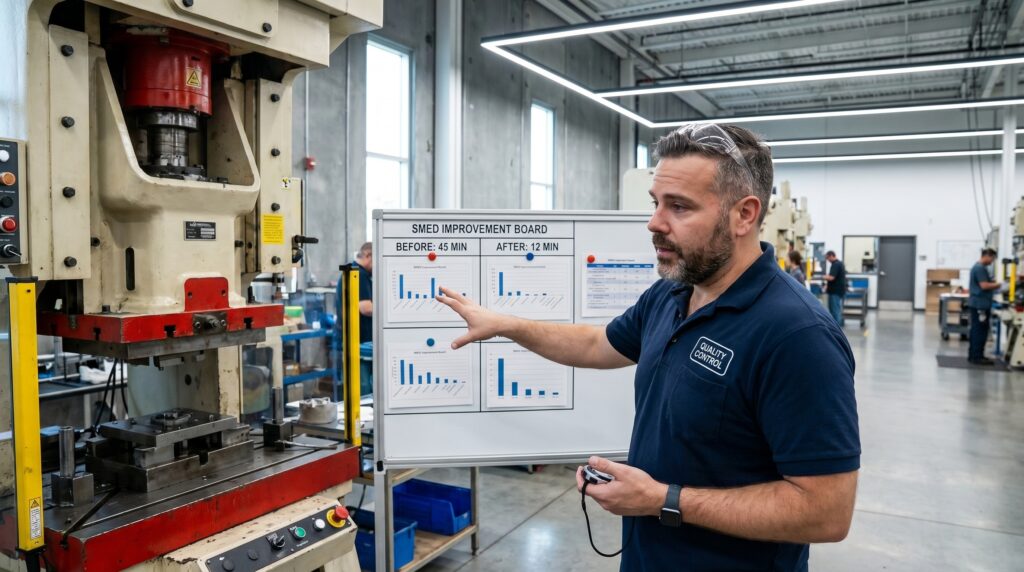
Factories that use OEE correctly calculate it rigorously and report it transparently. The denominator is fixed and honest. Planned Production Time is defined once and is not adjusted to exclude uncomfortable downtime. If a changeover takes 45 minutes instead of the planned 20, the extra 25 minutes is an availability loss. Full stop. It is counted, displayed, and discussed in the shift handover.
The Nameplate Rate is physically verified. Someone actually times the machine running at full speed with optimal material and confirms the theoretical cycle time. If the OEM specification says 8 seconds and the machine has never achieved better than 9.5 seconds in real conditions, the rate is set at 9.5 seconds. An engineering project is opened to understand the gap, rather than pretending the machine is underperforming.
Small stops are counted, and quality includes rework. The five-second micro-stops that operators clear by tapping a sensor are tracked collectively through the difference between gross output and net output. A part that needed a second operation to meet specification is treated as a quality loss. The factory stops hiding the cost of rework labour and machine time in standard cost accounting.
Gaming the Metric vs. Diagnosing the Process
Managing the Number
- Redefining planned production time to exclude downtime
- Accepting unverified OEM nameplate rates
- Classifying rework as good production to inflate quality
- Using OEE as a blunt performance review tool for staff
Diagnosing the Process
- Counting every minute of changeover as an availability loss
- Timing actual machine cycles to set realistic baselines
- Tracking micro-stops and treating rework as a quality failure
- Reporting component losses to trigger targeted improvement
Technology Cannot Fix a Cultural Problem
The irony of modern OEE is that the technology to make it honest has never been more accessible. IoT sensors can track machine state continuously. Automated data collection eliminates the temptation to round, exclude, or forget. Machine learning algorithms can classify stops and identify patterns that human analysts miss. A factory with a modest technology investment can know exactly where every minute of lost production went.
But technology cannot fix what is fundamentally a cultural failure. If the organisation’s response to a low OEE number is to shoot the messenger, cut budgets, or eliminate bonuses, no amount of automation will help. The data will still be manipulated. The exclusions will multiply. The number will drift toward whatever the organisation finds acceptable, regardless of the reality on the shop floor.
If you want to know whether your OEE system is working, ask yourself what happens when the number goes down. If someone gets blamed, an 8D corrective action is filed defensively, and the number mysteriously recovers next month, the system is broken. If a team gathers at the machine, looks at the loss data, identifies the biggest contributor, and starts a targeted improvement project, the system is working.