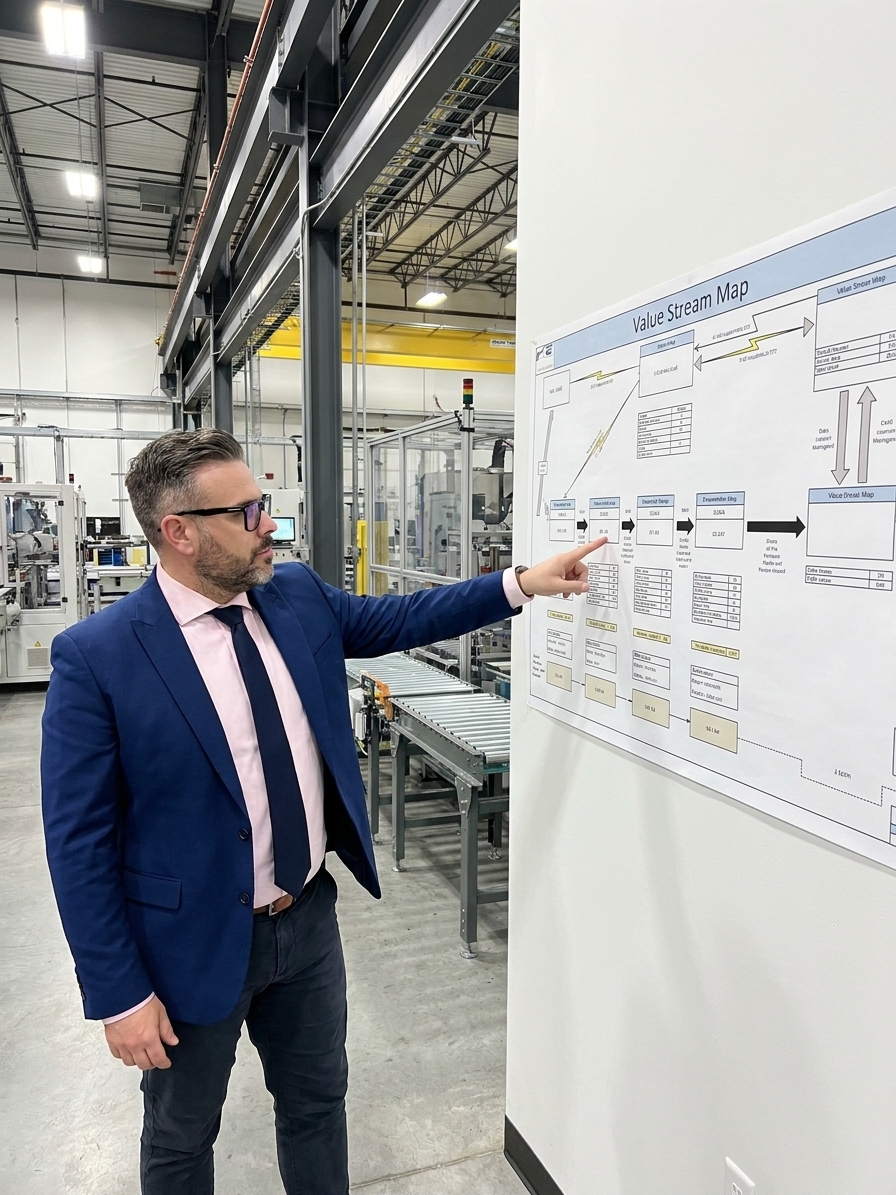
Value Stream Mapping (VSM) is the most potent diagnostic tool in lean manufacturing, yet it fails more often than it succeeds. The concept is rigorous: walk your entire production process from raw material to finished goods, document every step, every information flow, every inventory buffer, and every delay. The output is a single-page visual representation of how value actually flows through your operation, exposing the gap between what managers assume is happening and what the process physically delivers.
When executed correctly, a current-state map reveals the hidden architecture of waste. It highlights where material sits waiting, where information degrades, and where your process accumulates inventory to compensate for unresolved defects. It forces a direct comparison between total lead time and actual processing time. That gap is usually so severe that it compels immediate corrective action. The objective of VSM is never the map itself; it is the future-state design and the systematic elimination of identified waste.
In my experience auditing and implementing ISO 9001 and IATF 16949 systems, I see the same systemic failure across automotive and aerospace plants. The map is drawn, the data is calculated, and the future state is sketched. Then the workshop ends. The team disbands. The implementation actions are never funded, the kaizen bursts are never scheduled, and the current-state map becomes wallpaper. The organization did not do value stream mapping; it completed a drawing exercise.
The Map Treated as the Deliverable
The most common failure mode is treating the map as the final output rather than the input for transformation. Teams invest two days of intensive effort into getting the current-state map perfectly drawn. They calculate precise cycle times, verify inventory levels, and confirm information flows. They then treat the future-state map as a conceptual brainstorming session rather than a binding operational commitment.
The workshop concludes, the digital files are distributed, and the maps are printed on large boards for display. The cross-functional team feels a genuine sense of accomplishment. But if a VSM workshop produces a map without a fully funded implementation plan, assigned resources, and scheduled milestones, the effort was wasted. The value of VSM is realized only when the future state physically replaces the current state on the shop floor.
A current-state map is a means, not an end. When leadership treats the drawing exercise as a completed project, the implementation phase is starved of resources before it even begins. The waste identified on the map remains embedded in the process. The organization loses trust in the methodology because they confuse the documentation of a problem with the resolution of it.
Current-State Fiction Built on Assumptions
The second failure mode is that the current-state map does not reflect physical reality. This occurs when the mapping team relies on standard work documents, SOPs, and verbal briefings rather than direct observation. The map accurately reflects what the quality manual states, but it completely misses what the operators actually do to meet takt time and ship on schedule.
Operators routinely omit informal rework loops that are absent from formal procedures. Supervisors fail to mention the auxiliary storage areas used to hide overflow inventory. The quality team ignores the 100% sorting operation triggered by ongoing supplier defects because it falls outside the official PFMEA scope. A map built on assumptions rather than gemba observation generates false confidence and guarantees that the future state will target the wrong constraints.

The first principle of VSM is direct observation. If your mapping team spends more time in a conference room than on the production floor, the resulting map is a technical fiction. To build a map that drives actual improvement, the team must follow the material from goods-in receiving to final dispatch, timing operations with stopwatches and counting physical inventory at every staging point.
Future-State Fantasy and Missing Mechanics
When teams turn to the future-state map, they often substitute aspiration for engineering. They draw idealized processes featuring seamless one-piece flow and kanban systems connecting every workstation, without calculating the technical requirements. The future state must be bounded by practical constraints, not drawn as a utopian vision that ignores basic manufacturing physics.
A functional future-state map requires detailed sequencing logic, specific container sizes, and defined signal mechanisms. It must account for staffing implications, equipment OEE, and SMED changeover requirements. If your future state demands eliminating 90% of your inventory and implementing pull systems your team has never operated, it is not a design. It is a fantasy that the organization will immediately recognize as impossible and quietly ignore.
The future state must stretch the organization without insulting its intelligence. It should specify the exact technical modifications required, the capital expenditure needed, and the training prerequisite for the workforce. A future-state map that lacks these mechanical details provides no actionable path forward and gives implementers an easy excuse to abandon the initiative.
Standard VSM Diagnostic Ratios
Zero Accountability for Implementation
VSM workshops are typically facilitated by a continuous improvement or quality team and attended by representatives from production, engineering, and materials. The implementation plan is distributed across these functions with generic action items like reducing setup time or establishing kanban loops. When the workshop ends, these action items are handed to managers already struggling to meet daily production targets.
Because no single value stream owner is appointed, accountability dissolves immediately. No budget is specifically allocated for the kaizen bursts. No project plan is entered into the formal management system. No executive sponsor commits to reviewing progress at weekly tier meetings. The action items sink to the bottom of overloaded to-do lists and die from administrative neglect.
A cross-functional team is useful for mapping. A single accountable leader is mandatory for implementation.
Implementation requires a designated value stream manager whose performance metrics are directly tied to the transformation. This individual must have the authority to reallocate resources, mandate SMED workshops, and escalate blockers to senior leadership. Without that single point of accountability, the cross-functional team that drew the map will never convert it into physical process changes.
Integrating the Map with Daily Management
Organizations that succeed with VSM do not treat the map as a standalone document. They integrate the data boxes directly into their daily operational management. The cycle times, scrap rates, and inventory turns documented on the map become the exact metrics tracked on the floor's daily tier boards and verified during layered process audits.
The map must drive the agenda of the daily management huddles. When a Cpk drops below the 1.33 threshold on a specific machining center, it must be cross-referenced against the value stream map to understand the downstream impact. If the map is not actively referenced during daily problem-solving sessions and tier meetings, it has already failed its purpose as a diagnostic tool.
I have audited plants where the VSM was completely disconnected from the IATF 16949 core tools. The PFMEA identified high risk priority numbers, but the value stream map ignored those constraints entirely. The map and the quality system must speak the same language. The bottlenecks identified on the shop floor map must directly inform the control plans and the statistical process control parameters enforced by the quality team.
| Failure Characteristic | Wallpaper Organization | Implementation Organization |
|---|---|---|
| Data Source | Standard work and SOPs reviewed in a conference room | Direct floor observation with stopwatches and inventory counts |
| Accountability | Distributed across a cross-functional team with no single owner | Assigned to a dedicated value stream manager with budget authority |
| Follow-up | Map printed and mounted; no formal review schedule | Remapped every 12-18 months or upon major product mix changes |
| Metric Integration | Cycle times and lead times tracked separately on the map | VSM data boxes directly feed the daily tier management boards |
The Discipline of Remapping
Even organizations that achieve initial success with their future-state implementation often fail to repeat the cycle. They treat VSM as a one-time project rather than a continuous management discipline. The current-state map drawn eighteen months ago becomes obsolete as new products are introduced, equipment degrades, and customer demand patterns shift. The constraints move, but the map remains static.
Value stream mapping requires a remapping cycle of every twelve to eighteen months. As you eliminate waste in one area, the bottleneck physically moves to another part of the process. The kanban sizes calculated during the initial workshop will no longer be valid once volume or product mix changes. An organization that maps its value stream once and stops is attempting to manage a dynamic system with static data.
The map is the starting point, not the territory. The journey begins when leadership walks back onto the floor and starts systematically removing waste—one inventory buffer, one delayed information flow, one unnecessary inspection step at a time. The discipline is in the repetition: you map, you implement, you verify, and then you map again to find the next layer of hidden waste.
Honesty as a Prerequisite for Flow
VSM is fundamentally an exercise in operational honesty. It forces an organization to look at its process without the comforting narratives that managers construct. A well-constructed current-state map strips away assumptions and reveals the physical truth: this is how long the process actually takes, this is how much capital is tied up in work-in-progress, and this is the actual percentage of value-added time the customer pays for.
Organizations that benefit from VSM are those that can tolerate that truth and immediately fund the corrective actions. Organizations that fail are those that find the data too uncomfortable, so they soften it, fictionalize it, or simply hang the map on the wall and look away. If your map is on the wall but not in your daily management conversations, it is decoration.
If the map is in your daily management conversations but not in your capital budget, it is a conversation piece. The transition from compliance documentation to genuine operational transformation requires leadership to treat the VSM not as an optional lean exercise, but as the architectural blueprint for the plant's physical and informational flow. Without that commitment, the waste you intended to eliminate simply becomes the mural you hang on the wall.