Most manufacturing plants measure quality the same way: a monthly review of reject rates, PPM (Parts Per Million), customer complaints, and audit findings. These lagging indicators tell you what happened last month. They do not tell you why it happened, and they give you no ability to prevent it next week.
Treating quality metrics as a historical record keeps your department in a permanently reactive state. Throughout my career implementing ISO 9001 and IATF 16949 systems in automotive and aerospace, I have seen countless organisations trapped in this cycle. They chase last week's defects instead of controlling this week's process.
Building an advanced quality metrics system means shifting focus to leading indicators. You must track process capability, correlate variables, and translate defect rates into financial impact. When you make this shift, metrics stop being a month-end burden and become an operational tool for real-time decision-making.
The Limitation of Lagging Indicators
Lagging indicators measure the output of a process that has already failed. PPM, scrap rate, and customer complaints are the consequences of uncontrolled variation. Relying on them exclusively means your quality control system is effectively a post-mortem operation. You are counting the bodies rather than preventing the accident.
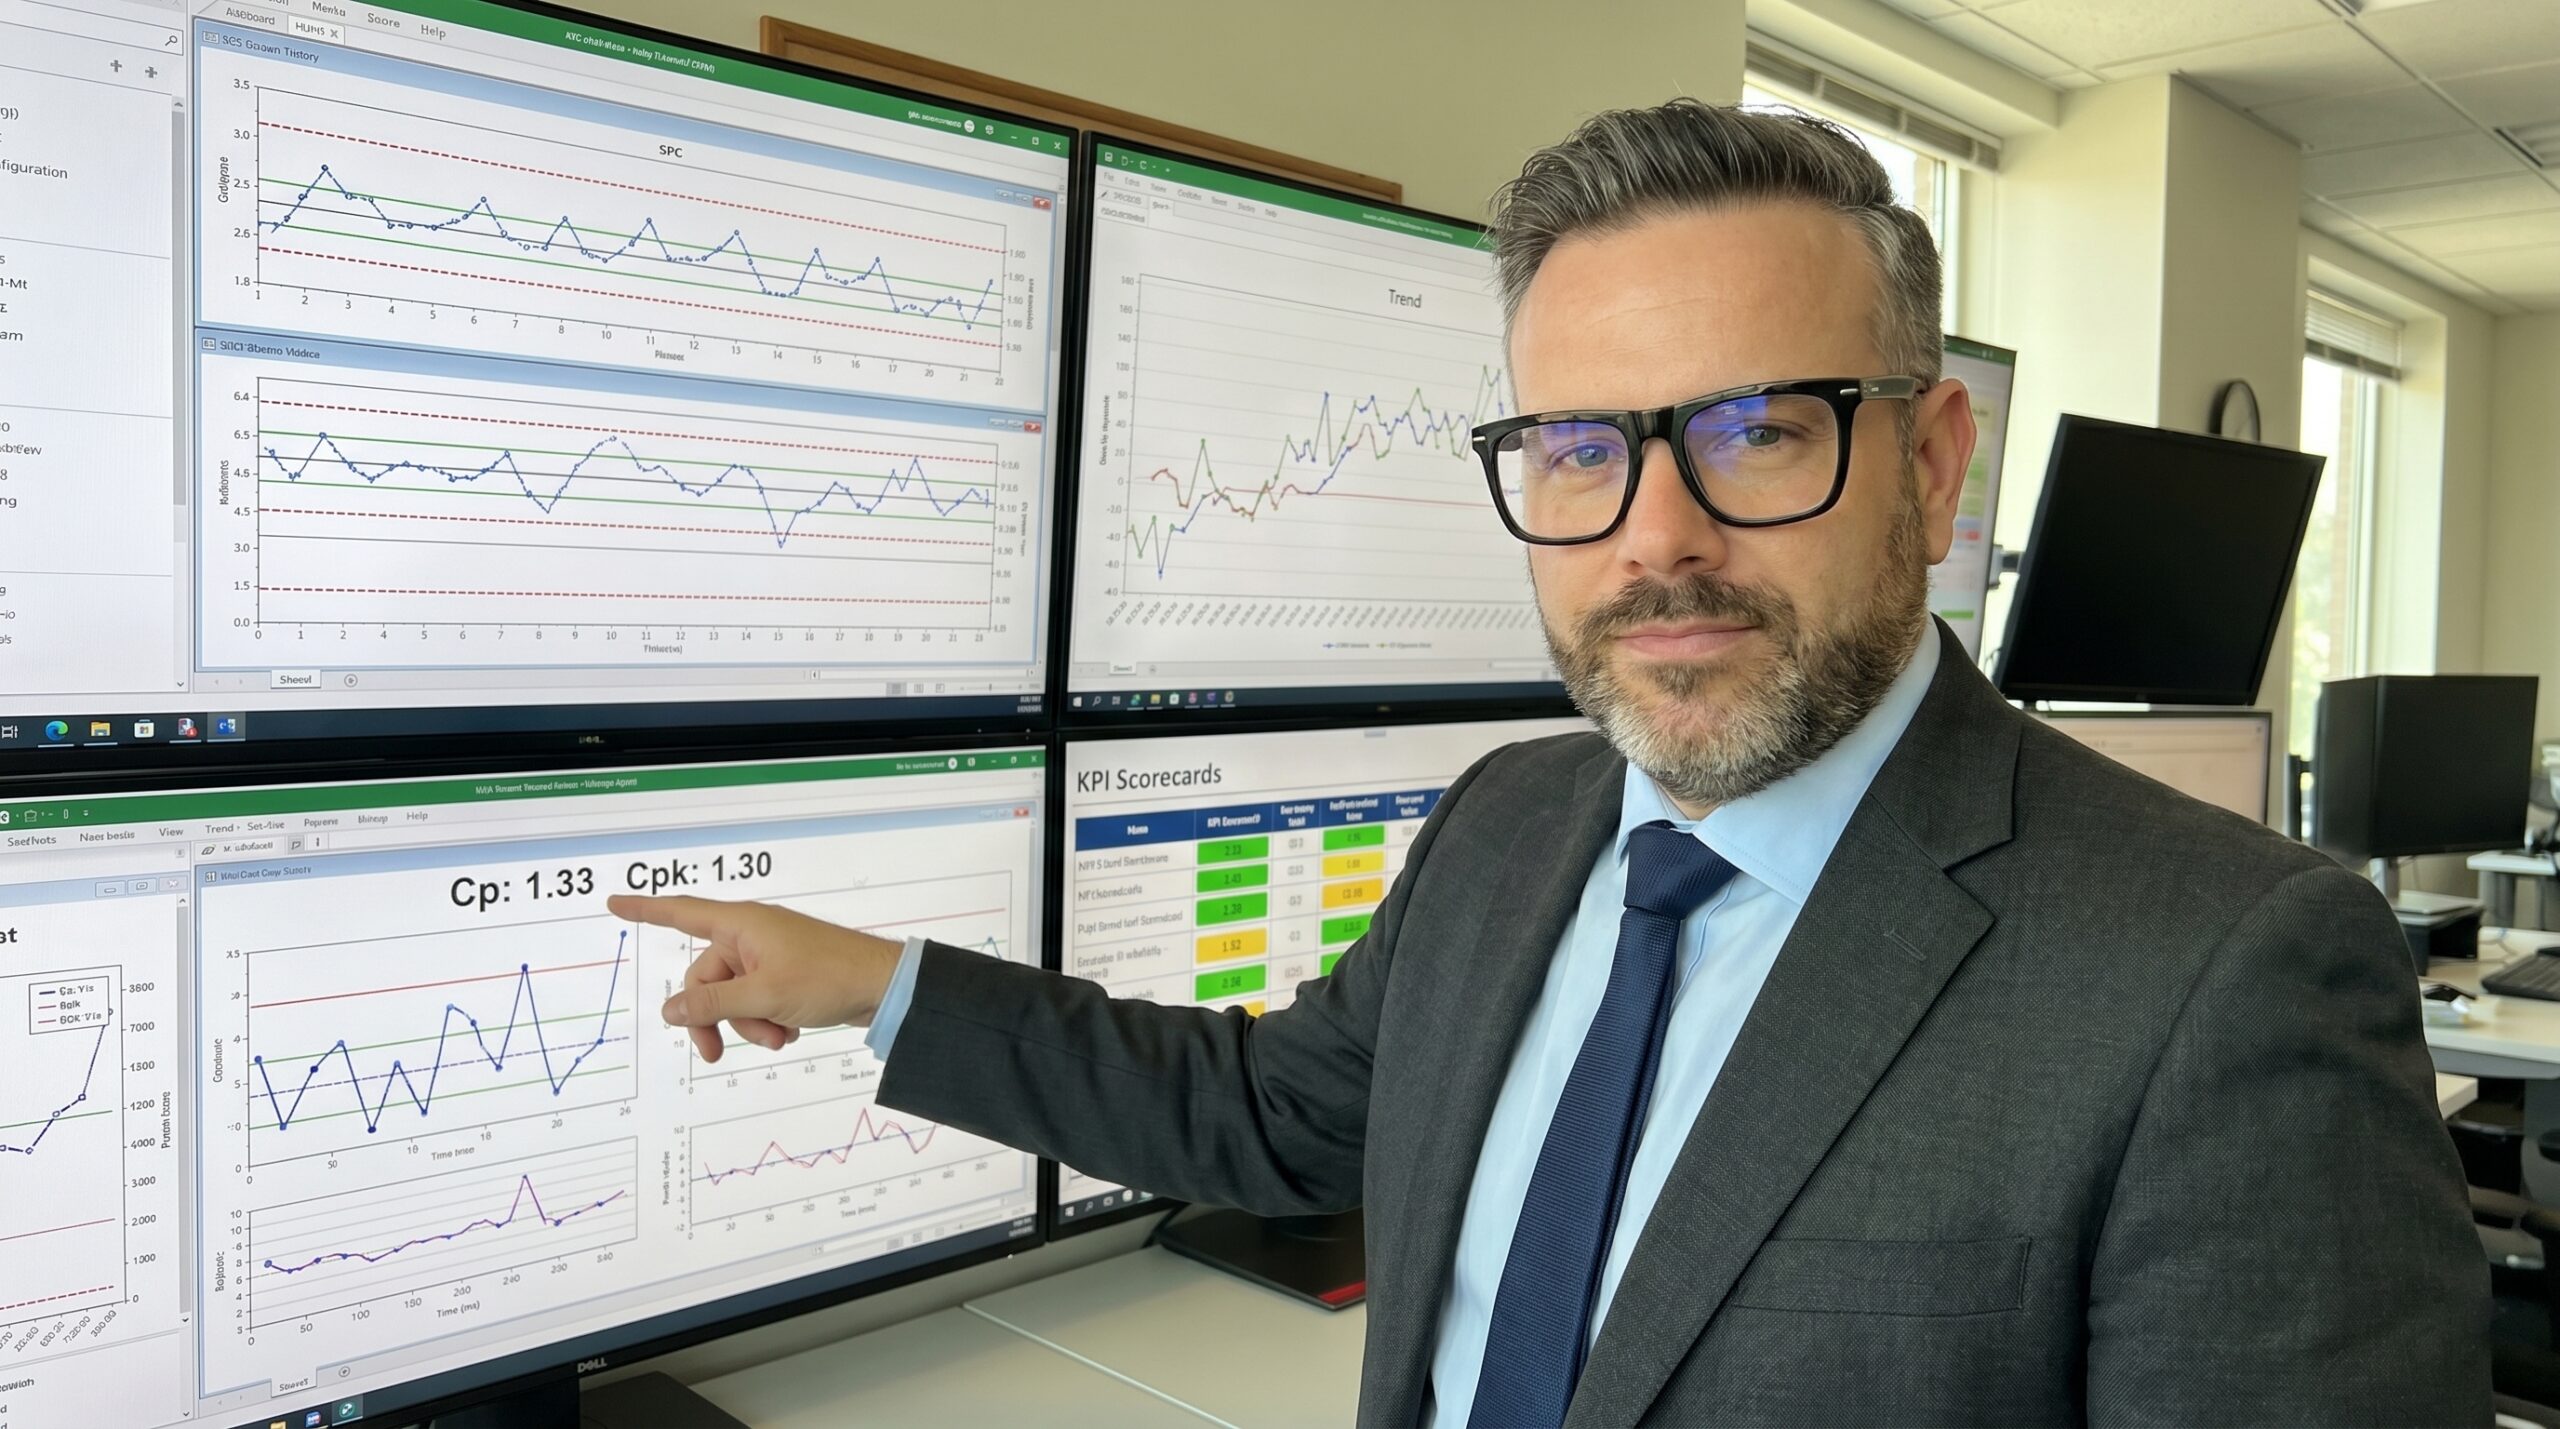
Leading indicators measure the inputs and the process stability itself. They predict defects before the part reaches final inspection. Metrics like First Pass Yield (FPY), machine uptime, and process capability (Cpk) provide the quantitative baseline required for preventive action. If your Cpk drops below 1.33, you are statistically guaranteed to produce non-conforming parts eventually.
The transition requires mapping which leading indicators drive which lagging outcomes. You must define the specific parameters—such as cycle time variance or torque tolerance drift—that precede a defect. Only then can you build a control plan that intervenes at the source of the variation, rather than at the inspection station.
Statistical Trending: Eliminating Random Noise
A single data point is noise. A manager looking at a daily reject rate of 2.5% has no context to determine if this is normal variation or the start of a systemic failure. Without statistical trending, teams repeatedly react to random fluctuations, exhausting engineering resources on natural variance while missing genuine process drift.
Statistical Process Control (SPC) uses control charts to distinguish between common cause and special cause variation. By applying moving averages and upper and lower control limits (UCL/LCL), you force the data to reveal its underlying pattern. A process that slowly drifts out of control becomes mathematically visible weeks before it produces a defect.
I have audited plants that tracked daily metrics but never charted them over time. When we plotted their 90-day reject rates, the trend line was screaming toward failure. Implementing basic SPC rules gave them a three-month early warning system, allowing maintenance to intervene before the line actually went down.
Reactive Reporting vs. Predictive Metrics
What teams do
- Review PPM and scrap rate at month-end
- React to defect spikes after parts are scrapped
- Track isolated metrics without context
- Present quality as a compliance burden
What works
- Monitor Cpk and FPY continuously on the floor
- Intervene when control limits are breached
- Correlate machine variables with defect outputs
- Present quality as a measurable financial return
Correlation Analysis: Finding the Root Variable
Most quality departments track metrics in silos. Reject rates sit in one spreadsheet, machine uptime in another, and operator performance in an HR database. Analysing these metrics independently hides the physical relationships that actually cause defects. A high reject rate is a symptom; the cause is usually a combination of machine wear, material variance, and operator deviation.
Correlation analysis forces you to plot these variables against each other. Using scatter plots or a correlation matrix, you map how strongly one variable influences another. For example, you might find a strong negative correlation between machine calibration drift and dimensional accuracy. When you quantify that relationship, you stop guessing at root causes during an 8D investigation.
Regression analysis takes this a step further by allowing you to model the exact impact of fixing a specific variable. If data shows that increasing preventative maintenance on a specific CNC centre reduces scrap by a predictable margin, you have a business case. You stop treating maintenance as overhead and start treating it as a direct lever for quality improvement.
Business Impact: Translating Defects into Cash
Quality professionals speak in PPM, Cpk, and non-conformance counts. Senior management speaks in operational expenditure, margin, and return on investment. If you cannot translate your quality metrics into financial terms, your improvement projects will remain unfunded. The Cost of Quality (COQ) is the translation mechanism.
COQ encompasses prevention costs, appraisal costs, and the costs of internal and external failure. When you quantify the labour, material, and warranty costs associated with a 2.5% reject rate, the number becomes actionable. You can calculate the precise Return on Investment (ROI) for a new measurement system or a process upgrade.
A Cpk of 1.33 is an engineering target. The financial cost of not hitting it is what buys the new equipment.
In my experience building QA departments for automotive suppliers, presenting the Cost of Quality to the board changes the conversation. Quality ceases to be a regulatory burden and becomes a profit centre. When management sees that investing in mistake-proofing (Poka-Yoke) or automated vision systems directly reduces the cost of external failure, securing the capital expenditure becomes straightforward.
Implementing a Real-Time Quality Dashboard
Static PDF reports are obsolete. A modern quality system requires a digital dashboard that visualises leading and lagging indicators in real-time. Tools like Power BI or Tableau, integrated directly with your ERP and manufacturing execution system (MES), allow operators and engineers to see process drift the moment it occurs.
The dashboard must be built around actionable thresholds, not just data display. If Overall Equipment Effectiveness (OEE) drops below a defined target, or a control chart breaches statistical limits, the system must trigger an automatic alert. This shifts the quality function from periodic auditing to continuous, proactive monitoring.
Accessibility is critical. If the dashboard is restricted to the quality manager's office, it fails. Operators on the shop floor need immediate access to the relevant process parameters for their station. When the people running the process can see the direct impact of their adjustments on quality metrics, accountability and engagement increase organically.
Deploying a Predictive Quality System
- 01Metric AssessmentIdentify current lagging indicators and define the specific leading inputs that drive them.
- 02Statistical MappingImplement SPC control charts and run correlation analysis on machine and process data.
- 03Financial TranslationCalculate the Cost of Quality to build ROI models for proposed engineering changes.
- 04Dashboard IntegrationConnect data sources to a live visualisation tool with automated control-limit alerts.
- 05Operational TrainingTrain floor staff to read live metrics and intervene based on leading indicator drift.
Sustaining the Transformation
Implementing advanced metrics is a mechanical process; sustaining them is cultural. Standard work must be updated to include responses to leading indicator thresholds. When a process capability drops, operators need a defined protocol for adjustment, containment, or escalation before a non-conforming part is ever produced.
Regular management reviews must focus on these predictive metrics, not just historical scrap rates. If the leadership team spends the meeting reviewing last month's PPM, the organisation will immediately revert to a reactive posture. The entire system depends on management enforcing the discipline of preventive action.
Quality metrics should tell a clear story about process stability, risk, and financial impact. When you stop treating data as a historical record and start using it as a real-time control mechanism, you fundamentally change the manufacturing system. You move from counting failures to engineering success.