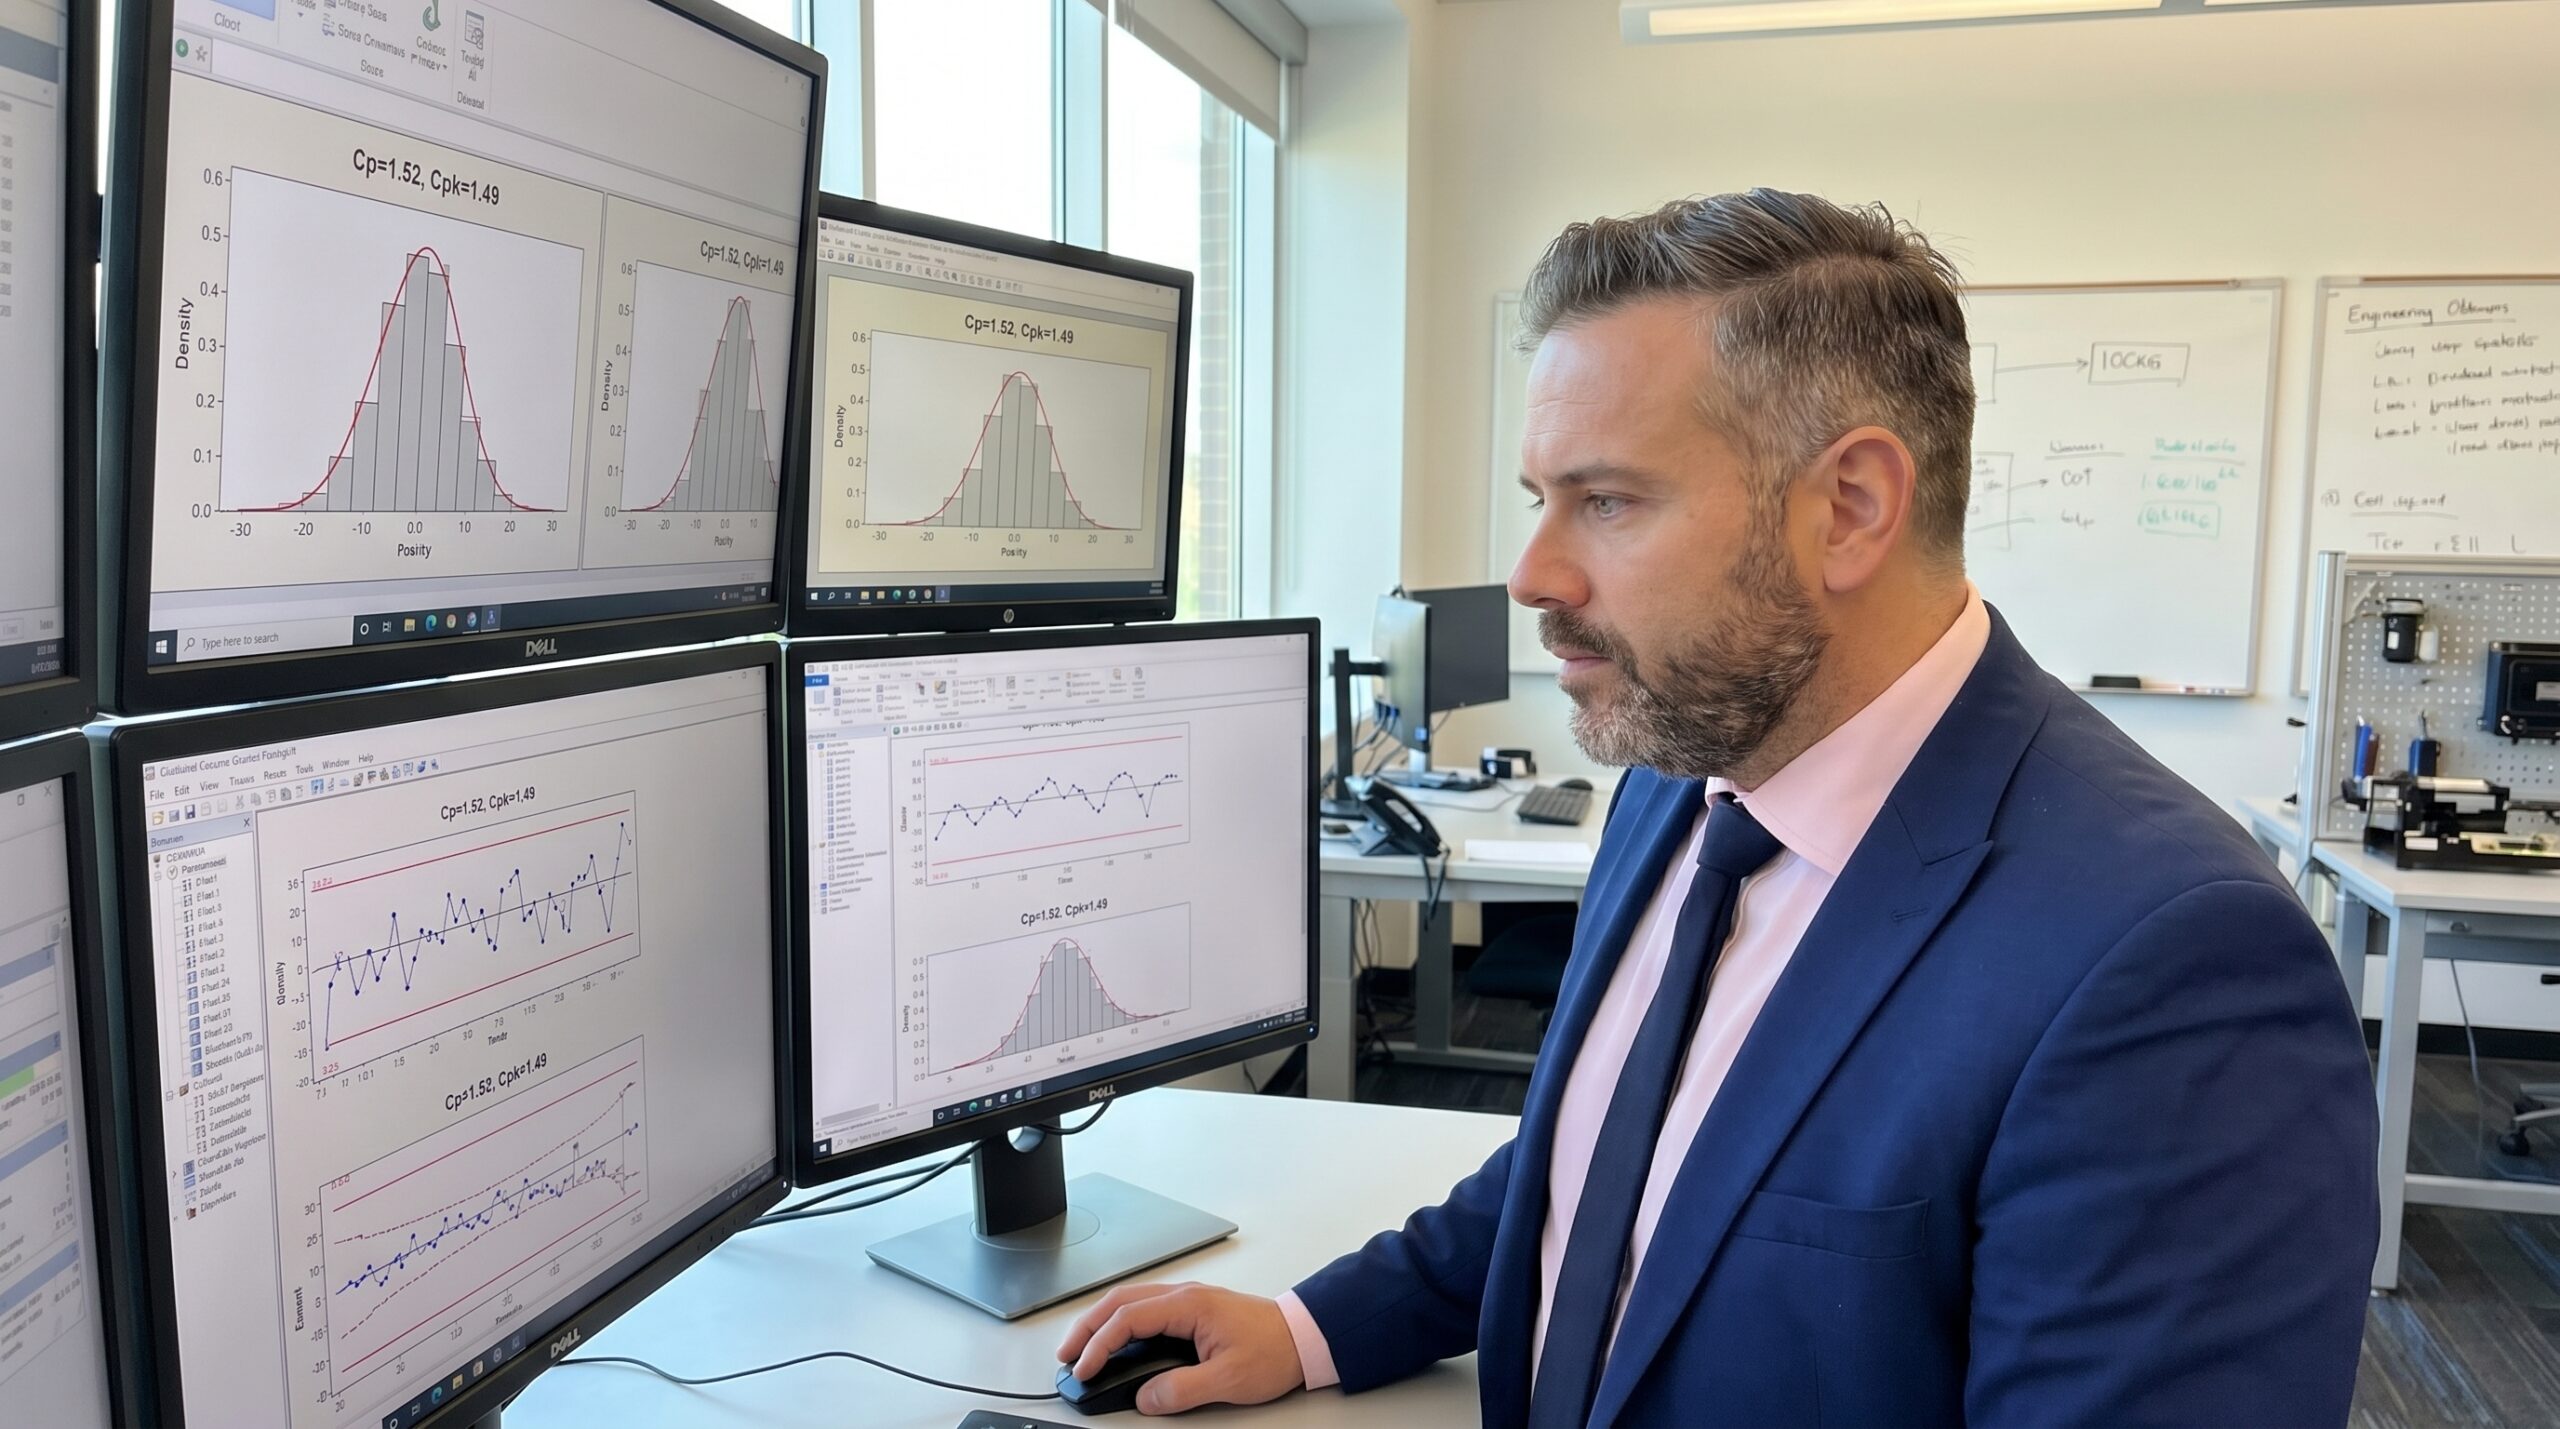
Ask a supervisor how the line is running and you will often hear that everything is fine because the measurements fall inside the specification. The SPC chart confirms it: every point sits neatly between the upper and lower limits. By the crudest definition, the process is compliant.
But compliance is not capability. If those plotted points scatter across the full width of the tolerance band, the process is riding the guardrails. A slight shift in material hardness or tool wear pushes a percentage of output beyond the limit and straight into nonconformance. The standard deviation is too high relative to the tolerance window.
Compare that to a line running the same product with points clustered tightly around the target value. That operation absorbs variation without breaching the limit. Both processes are technically within specification today, but only one is structurally safe. The metric that quantifies this difference, and separates stable production from latent recall risk, is Process Capability.
The Mechanics of Cp and Cpk
Cp, or Process Capability, measures the potential fit between the width of your tolerance and the natural spread of your process. The formula is the specification range divided by six standard deviations: Cp = (USL – LSL) / 6σ. A Cp of 1.0 means your process spread exactly fills the tolerance band, assuming perfect centring. It is a purely theoretical ceiling.
Cpk, or Process Capability Index, measures actual performance by factoring in process centring. It calculates the distance from the process mean to the nearest specification limit, divided by three standard deviations: Cpk = min[(USL – μ) / 3σ, (μ – LSL) / 3σ]. If your process drifts off-target, Cpk drops below Cp. The gap between the two indices is a mathematical measure of how far off-centre you are operating.
Industry baseline thresholds are non-negotiable. A Cpk of 1.33 is the absolute minimum for serial production in most IATF 16949 certified environments, yielding roughly 63 defective parts per million. Aerospace and safety-critical automotive characteristics typically demand 1.67. World-class operations push for 2.0, where the defect rate approaches zero and inspection becomes a verification of system stability rather than a sorting mechanism.

Quantifying Defect Risk
Cpk is not an abstract rating. It is a direct statistical predictor of how many defective parts you will ship if the process remains in its current state. Understanding the relationship between the index and expected Parts Per Million (PPM) is critical for setting realistic quality targets and prioritising improvement efforts.
When a process operates below a Cpk of 1.0, it is statistically incapable. You are producing thousands of defects per million, and the only reason they do not all escape is because of downstream inspection. This is detection, not prevention. It is the most expensive way to manage quality. Raising the index requires attacking the standard deviation, the mean, or both.
Cpk Thresholds and Expected Defect Rates
A Practical Calculation
Consider a milling operation machining a dimension of 50.000 mm with a bilateral tolerance of ±0.025 mm. The upper specification limit (USL) is 50.025 mm, and the lower specification limit (LSL) is 49.975 mm. The total tolerance window is 0.050 mm. How the process behaves inside that window dictates its capability.
Process A runs with a mean of 50.010 mm and a standard deviation of 0.012 mm. The process is off-centre and highly variable. The calculated Cp is 0.69, and the Cpk is a disastrous 0.42. This process is statistically incapable. It relies entirely on inspection to catch the out-of-tolerance parts it inevitably generates.
Process B runs the same part with a mean of 50.001 mm and a standard deviation of 0.004 mm. The process is centred on target with minimal variation. The calculated Cp is 2.08, and the Cpk is 2.0. The difference is structural. Process B is functionally incapable of producing a defective part under normal conditions, rendering 100% inspection unnecessary.
The gap between these two scenarios is not luck or operator skill. It is the result of controlled inputs. Reducing standard deviation from 0.012 to 0.004 requires specific engineering interventions, not generalized continuous improvement programmes. You have to identify the dominant sources of variation and eliminate them systematically.
Levers for Improvement
Raising Cpk requires manipulating three variables: reducing variation, centring the mean, or widening the tolerance. Widening the tolerance is rarely an option and usually triggers an engineering change request. Quality engineering must therefore focus on the first two levers: shrinking the standard deviation and driving the mean to the target value.
To reduce variation, standardise operator work methods, tighten machine maintenance schedules, and enforce material lot consistency. Implement Statistical Process Control (SPC) to detect shifts before they breach limits. To centre the process, deploy precise machine setup, automate tool wear compensation, and conduct regular SPC reviews. The goal is to decouple the process from human variability.
Cp tells you how good your process could be. Cpk tells you how good it actually is.
Executing a Process Capability Study
- 01Verify StabilityConfirm the process is in statistical control using an SPC control chart before calculating any capability index.
- 02Gather DataCollect a minimum of 30 consecutive parts from a normal production run under standard conditions.
- 03Calculate Cp and CpkCompute the standard deviation and mean to establish both potential and actual capability.
- 04Identify the GapIf Cpk is significantly lower than Cp, the primary issue is centring. If both are low, variation is the killer.
- 05Implement ControlsAdjust the mean, reduce variation sources, and verify the improvement with a follow-up study.
Short-Term Ppk Versus Long-Term Cpk
Practitioners frequently confuse Cpk and Ppk. Cpk applies to a stable, serial production process measured over a long period. It uses historical data captured across multiple shifts, material lots, and operator cycles. It represents the long-term reality of your manufacturing environment.
Ppk, or Preliminary Process Capability, applies to new processes, trial runs, and initial studies. It uses short-term data, often from a single shift or a single machine setup. The mathematical formula is similar, but the predictive power is different. A high Ppk proves a process is capable on its best day; a high Cpk proves it is capable every day.
The PPAP submission process mandated by IATF 16949 codifies this distinction. For initial process studies during PPAP, the target is Ppk ≥ 1.67. This threshold demonstrates that a process has the fundamental capability to proceed into serial production. Once serial production begins, the ongoing quality target shifts to maintaining a Cpk ≥ 1.33 or 1.67, depending on the characteristic's severity.
Capability as a Strategic Indicator
Process Capability is not merely a number for a quality report. It is the definitive operational narrative of your manufacturing process. A low Cpk indicates that your process relies on luck and inspection to deliver conforming product. A high Cpk indicates a robust system where inputs, machinery, and methods are locked into a predictable output.
The difference between Cp and Cpk maps your improvement roadmap. If your Cp is high but your Cpk is low, the solution is relatively straightforward: adjust the mean. If both indices are low, you have a variation problem that requires deeper engineering work to resolve. Treating these metrics as leading indicators prevents the fire-fighting that dominates low-maturity quality organisations.
In plants with mature quality systems, capability data drives investment decisions. If a critical characteristic consistently hovers at a Cpk of 1.2 despite optimised inputs, the process is fundamentally incapable. Management must either invest in new machinery, automate the operation, or engineer the tolerance out of the design. Ignoring the data guarantees ongoing scrap, rework, and customer complaints.