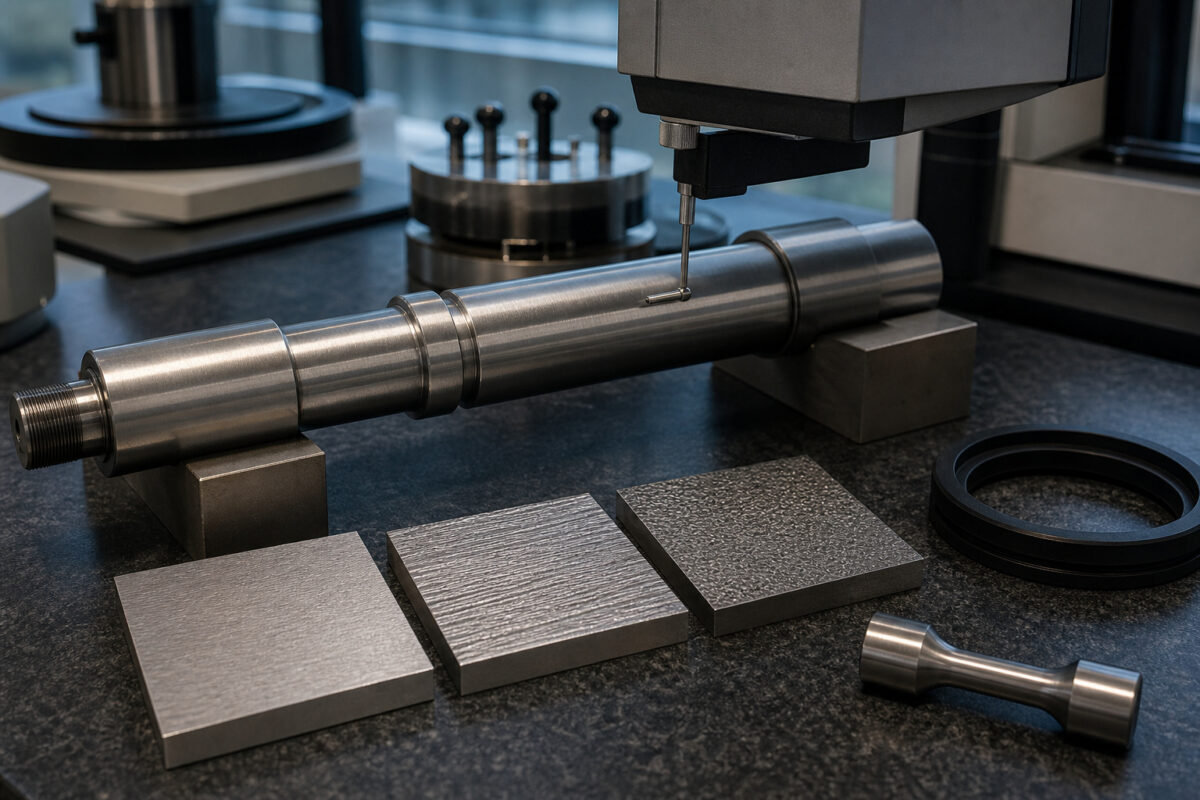
Walk through any machine shop and you will find drawings with a single roughness callout: Ra 0.8, Ra 1.6, Ra 3.2. The arithmetic mean roughness has become the default language of surface finish across both automotive and aerospace supply chains. It is easy to measure, easy to understand, and built into every basic profilometer on the shop floor. Supervisors and operators alike know what the number means — or believe they do.
The problem is that Ra describes almost nothing useful about a surface. Two profiles can share identical Ra values whilst differing completely in peak height, valley depth, core roughness, and bearing area. One surface might seal beautifully against an elastomer gasket. The other might leak before the machine leaves the test cell. The number alone told you nothing about which was which.
Across two decades of quality engineering in automotive powertrain and aerospace actuation programmes, I have found that surface roughness is the most under-specified characteristic on most drawings. Engineers treat it as a cosmetic note rather than a functional requirement. By the time parts arrive at inspection, it is too late to ask what the surface actually needs to do.
What Ra Measures and What It Hides
Ra is the arithmetic average of the absolute values of the profile deviations from the mean line, evaluated over a single sampling length. It takes every point along the traced profile, measures how far each sits from the centre reference, and averages those distances. The mathematics is simple, and therein lies its fundamental weakness as a functional specification.
Consider two surfaces. The first has gentle, regular undulations — smooth rolling hills of consistent height. The second has a mostly flat plateau punctuated by a few deep, sharp valleys and a handful of aggressive spikes. Both can produce exactly the same Ra value. The averaging mathematics cannot distinguish between them because the deviations cancel out symmetrically around the mean line.
This matters enormously in functional contexts. A sealing surface with deep isolated valleys will channel fluid regardless of how low the Ra reads. A bearing journal with sharp peaks will shred the interface layer long before the average roughness suggests any problem. Ra hides the very features that drive functional failure, and it does so whilst giving everyone false confidence that the surface has been properly controlled.
In my experience reviewing non-conformance reports, the gap between Ra acceptance and functional adequacy accounts for a significant portion of sealing and wear-related field returns. The drawing said Ra 0.8. The parts met Ra 0.8. The seals leaked anyway. The parameter was never capable of describing the leak path.
Rz and the Peak-to-Valley Question
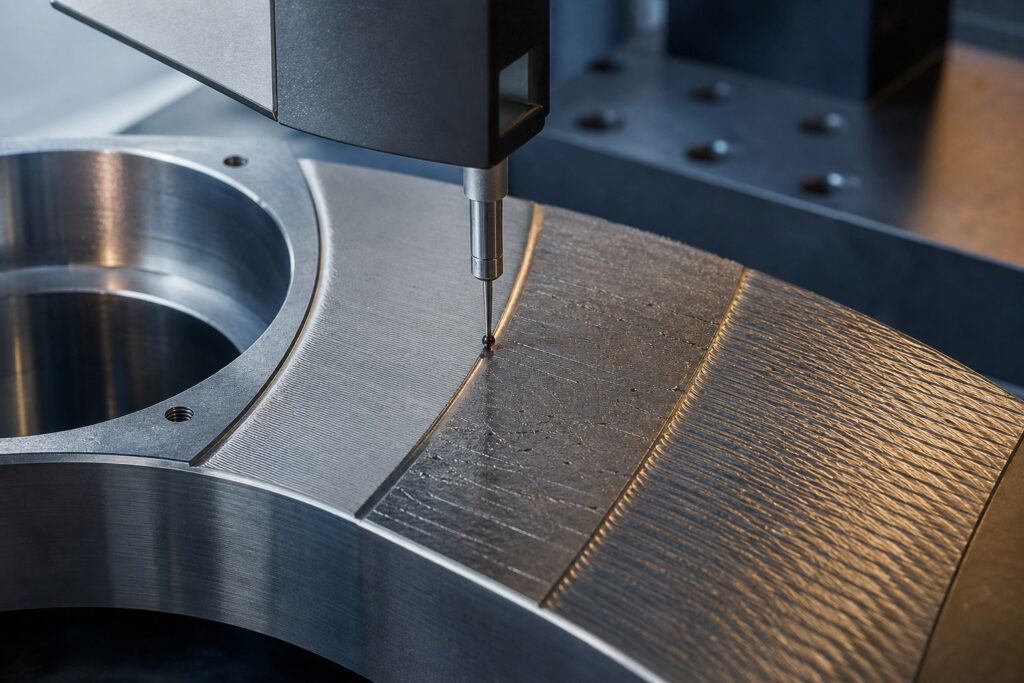
When designers sense that Ra is insufficient, they often reach for Rz — the maximum height of the profile, calculated as the sum of the largest peak height and the largest valley depth within a sampling length, averaged across five consecutive sampling lengths. Rz at least acknowledges that peaks and valleys exist, which makes it a step forward.
Rz gives you a sense of the total vertical extent of the surface texture. For hard-on-hard contacts subject to fatigue — gear teeth, cam lobes, rolling element raceways — the peak height above the core material directly influences asperity contact stress and the initiation of micro-pitting. Knowing the worst-case topography helps predict whether the surface will survive cyclic loading.
But Rz still has blind spots. It tells you the extremes but nothing about the shape of the profile between them. A surface with a single catastrophic scratch will report an Rz value identical to one with uniformly aggressive texture across the entire evaluation length. The first might be a local defect you can tolerate; the second might be process drift that will destroy every part in the batch.
I recommend Rz as a secondary callout for fatigue-critical and wear-prone interfaces, but only alongside parameters that describe the profile's distribution, never as a replacement for a more complete specification. Rz without context is merely a different way of being wrong about the surface.
Filtering: The Invisible Decision That Changes Everything
Before any parameter — Ra, Rz, or anything else — can be calculated, the raw profile must be filtered. The measured trace contains form error, waviness, and roughness all superimposed on one another. Surface roughness standards require you to separate these components mathematically before evaluation, and the choices made during this step fundamentally alter the reported values.
The cutoff length, or λc, determines what the filter treats as roughness versus waviness. Select a 0.8 mm cutoff and you capture fine texture whilst suppressing longer wavelength undulations. Select 2.5 mm on the same surface and you fold those undulations into the roughness evaluation, inflating the result. Same surface, same physical profile, entirely different numbers.
Gaussian filtering is the modern standard, defined in ISO 16610-21 and referenced throughout the ISO 4287 and ISO 4288 framework. Older drawings may still reference 2RC filtering, which behaves differently at the boundaries of the evaluation length and can distort short surfaces. When reviewing supplier inspection reports, I always check which filter and cutoff were used.
Mismatched filtering between design intent and production measurement is a common cause of false acceptance and false rejection. The cutoff must match the functional scale of the surface feature that matters. For sealing surfaces interacting with elastomer lip geometry, a 0.8 mm cutoff is typical. For larger conformal interfaces, longer wavelengths may influence behaviour, and a 2.5 mm cutoff becomes appropriate.
| Application | Typical λc (mm) | Rationale |
|---|---|---|
| Sealing surfaces, fine bores | 0.8 | Isolates short wavelengths that govern lip seal fluid film behaviour. |
| General machined faces, bearing journals | 0.8 | Captures the standard manufacturing texture of turned or ground features. |
| Large conformal interfaces, flange faces | 2.5 | Includes longer wavelength undulations that cause gasket bridging. |
The Rk Family and the Material Ratio Curve
For surfaces that must seal, bear load, or retain lubricant, the most informative parameters come from the material ratio curve — also called the Abbott-Firestone curve. This curve plots the bearing contact area as a function of depth into the surface, moving from the highest peaks down through the core roughness to the deepest valleys. ISO 13565-2 and ISO 25178 define the parameters derived from this analysis.
The Rk family breaks the profile into three functional zones. Rk itself represents the core roughness depth — the portion of the surface that carries the bulk of the load after initial running-in. Rpk, the reduced peak height, quantifies the material that will wear away quickly in early service. Rvk, the reduced valley depth, describes the deep troughs below the core that can retain lubricant or, on a sealing surface, provide leak paths.
For a cylinder bore interacting with piston rings, you want a controlled Rpk so the rings bed in quickly without excessive material removal, a stable Rk for long-term load bearing, and a modest Rvk for oil retention. Specify these parameters individually and the surface becomes engineered rather than merely described. The coating or surface treatment must also be considered, since it modifies the asperity behaviour captured by the curve.
For static gasket sealing against machined flanges, the requirements shift. Rpk should be minimal to prevent partial crush of the gasket material. Rvk should be tightly controlled because deep valleys create continuous channels that bypass the seal. A gasket surface specified only as Ra 1.6 might pass inspection and leak in service because nobody controlled the valley structure that actually governs sealing integrity.
Functional Zones of the Abbott-Firestone Curve
- Rpk (Reduced Peak Height)Material that wears away during early running-in; uncontrolled peaks accelerate interface failure.
- Rk (Core Roughness Depth)The load-bearing zone carrying the bulk of operational stress after the peaks have bedded in.
- Rvk (Reduced Valley Depth)Deep troughs below the core; essential for oil retention in cylinder bores, but a direct leak path on static gaskets.
Specifying for Sealing Applications
Sealing surface specification requires deliberate thought about what the seal must do. An elastomer lip seal relies on a thin fluid film maintained between the lip and the shaft. The surface must be smooth enough to prevent film rupture but possess enough micro-texture to carry lubricant. Too smooth and the lip runs dry; too rough and the lip wears rapidly. The balance is delicate and application-specific.
For radial shaft seals, the German standard DIN 3760 and its successor ISO 6194 provide guidance on appropriate surface parameters for the dynamic counterface. The specification typically calls for a specific Ra range combined with Rmax or Rz limits, and critically, it specifies the absence of lead — the spiral machining pattern that can pump fluid past the seal. Lead is a directional texture characteristic invisible to any amplitude parameter.
Static face seals on machined housings require a different approach. The relevant feature is the surface's ability to conform to the gasket under bolt load. Soft gaskets need a rougher surface to bite into; hard metal gaskets need a much finer finish to achieve seal integrity. In both cases, the waviness component — filtered out of roughness measurements — can dominate gasket performance. A surface with perfect Ra but excessive waviness will bridge and leak at the high spots.
My practical recommendation for sealing surfaces is to specify Ra or Rz as a baseline, add Rk parameters for the valley and peak structure, and explicitly call out waviness limits. Include the filter cutoff and evaluation length. State the manufacturing process — single-point turning, ground, lapped, or milled — because the process determines the lay direction and the texture morphology, both of which affect sealing independently of any single number.
Specifying for Fatigue-Critical Surfaces
Fatigue life originates at the surface. Initiation sites for fatigue cracks almost always occur where local stress concentration interacts with surface texture. For components subject to cyclic loading — connecting rods, valve springs, turbine discs, helicopter rotor hubs — the roughness specification must address the features that govern crack nucleation directly.
Sharp peaks concentrate stress at their tips. The asperity geometry, not the average roughness, determines whether the local stress exceeds the material's endurance limit. This is why aerospace fatigue-critical drawings often specify Rz or Rt rather than Ra — the extreme peak height provides a better proxy for stress concentration risk. Better still is specifying Rsm, the mean spacing of profile irregularities, which together with peak height gives a more complete picture of asperity sharpness.
Ra hides the features that drive functional failure, and it does so whilst giving everyone false confidence that the surface has been controlled.
Residual compressive stress from processes like shot peening or deep rolling dramatically improves fatigue performance, and it does so partly by modifying the surface topography. The peened surface may show a higher Ra than the ground surface it replaced, yet it will outlast the smoother version by orders of magnitude in fatigue. This apparent paradox — rougher but better — illustrates why amplitude parameters alone mislead.
For fatigue-critical parts, I advise specifying the manufacturing process and any surface treatment explicitly, alongside the roughness parameters. A note such as 'ground and shot peened per the applicable process specification, Ra 0.4 to 0.8, Rz 3.2 maximum after peening' communicates the functional requirement far more completely than a bare surface finish callout. The drawing must tell a story about what the surface must survive, not merely how smooth it should look.