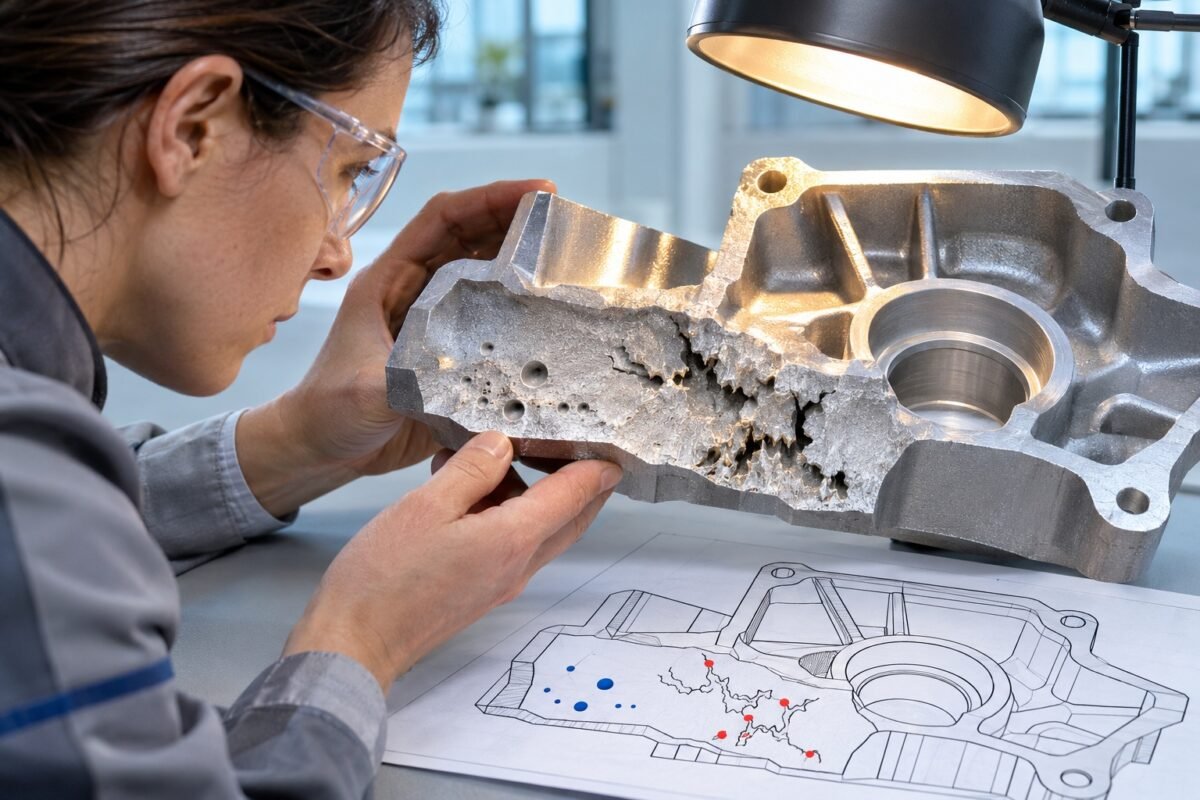
Porosity in a casting is not a mystery; it is a message from the process, delivered through the part. Most foundries already hold the decoding key in their defect records. What they lack is the discipline to treat porosity location, morphology and frequency as structured feedback rather than as a scrap reason code.
When you map defects by cavity, by position within the casting and by shift, porosity tells you which upstream variable has drifted: gating geometry, melt treatment, pouring temperature or die condition. Each defect family has a specific mechanism behind it, and each mechanism points to a different corrective action. Confusing the families wastes months of effort on the wrong variable.
This article sets out how to read that message: how to classify pores by morphology, how position implicates gating or feeding, how temperature errors leave a thermal signature, and how to grade radiographic acceptance against the function of each feature. It closes with the feedback loop that turns the defect map into process change.
The Grammar of Porosity: Morphology Before Cause
Before assigning blame, look at the pore itself under sectioning or fractography. Gas porosity appears as smooth-walled, roughly spherical cavities, often rounded and bright on a fracture surface. Shrinkage porosity is angular, dendritic and rough-walled, and tends to sit in thermal centres or under heavy sections where feeding arrived last. Entrapped oxide films and dross inclusions produce irregular, elongated defects frequently accompanied by fold-like features.
The distinction matters because each family has one dominant mechanism. Gas porosity means dissolved hydrogen or entrained air — a melt and tooling problem. Shrinkage means the solidification sequence outran the feed metal — a gating and risering problem. Oxide films mean the metal was turbulent somewhere between ladle and cavity — a pouring system problem. I have seen foundries chase pouring temperature for months on a defect that fractography would have identified as an oxide fold in five minutes.
Build the habit into routine work. Section the worst castings, photograph the pore structure at consistent magnification, and create a small reference library keyed to each part number. When a new defect cluster appears, the first question should always be: which family is this? Only then do you choose which process variable to interrogate. Skipping this step is the single most common cause of ineffective corrective action in casting plants.
Gating Geometry and the Turbulence Signature
Gating design leaves fingerprints on the porosity map. If defects cluster near the ingates or along the first-fill path, examine ingate velocity and runner geometry. Metal entering the cavity above the critical velocity for the alloy — commonly cited around half a metre per second for aluminium — will jet, entrain surface oxide and roll air into the front. Those defects freeze out where the flow first decelerates, so their position traces the fill pattern directly.
Feeding shortfalls show up differently. Shrinkage concentrated under bosses, in heavy-to-light transitions, or at the far end of the casting from the riser points to inadequate feed paths, chill placement that cut off a feeding channel, or riser necks that pinched off too early. Check the riser contact after knock-off: a shallow, flat stump with no pipe suggests the riser never fed; a deeply piped riser with shrinkage still in the part suggests the neck froze before the casting did.
The practical loop is simple: overlay X-ray and sectioning results on the casting drawing and mark every pore position for a meaningful batch. Cluster patterns move when you change a gating element, and that movement is direct experimental evidence. A gating change that relocates porosity from a machined face into a non-critical boss is a win even if total porosity barely changes, because acceptance is about location as much as volume.
Pouring Temperature and the Thermal Story
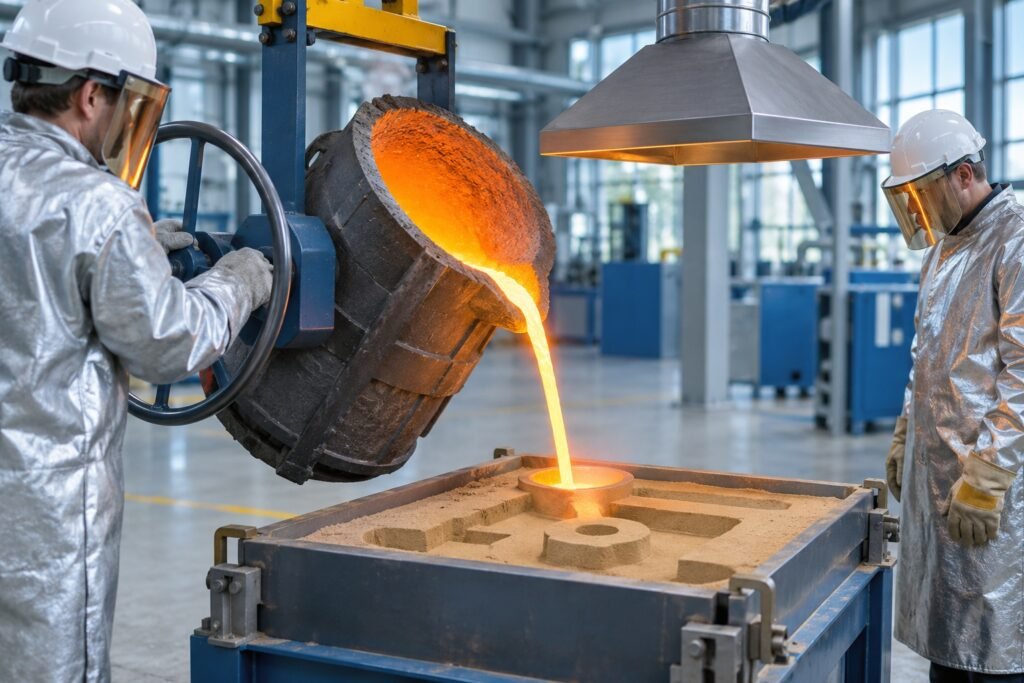
Pouring temperature errors produce porosity in both directions, and the defect map tells you which way you have drifted. Too cold, and you get misruns, cold shuts and gas trapped in a sluggish front that cannot vent properly; porosity tends to be fine, dispersed and paired with flow defects at thin extremities. Too hot, and you dissolve more hydrogen in aluminium melts, hold the casting liquid longer so shrinkage cavities grow in thermal centres, and coarsen the grain structure.
Measure at the point that matters. A pyrometer in the holding furnace tells you furnace state, not what entered the mould. Skimming, transfer and ladle travel all cost degrees, and that loss varies by operator and ladle condition. Instrument the pouring ladle or the launder, log the actual pour temperature per batch, and plot it against the defect map for the same batch. When the correlation appears — and it usually does once the data is paired properly — you have a controllable variable instead of an argument.
Degassing practice belongs in the same conversation. For aluminium, a reduced-pressure test on the melt before pouring gives a quick read on hydrogen content. A melt that passes the test but still shows gas porosity in castings is telling you the gas was entrained after the test — by turbulent pouring, wet refractories or a faulty transfer. That distinction alone has stopped several foundries I have advised from re-degassing a melt that was never the problem.
X-ray Acceptance Levels: Sorting Signal From Noise
Radiographic acceptance is not a single threshold but a graded system, and using it well means matching the acceptance class to the function of the feature being inspected. Automotive and aerospace specifications typically reference graded reference radiographs: castings are compared against images for each defect type and severity class, with the acceptable class assigned by zone or feature on the drawing. The critical machined sealing face gets a stricter class than a non-structural rib. That zoning is a design decision that quality must enforce consistently.
Film radiography and digital detector systems do not grade identically. Digital systems with good contrast enhancement reveal finer porosity than coarse-grain film, so a foundry transitioning to digital inspection often sees an apparent quality decline that is purely perceptual. Establish comparator baselines on the new system, retrain inspectors against graded reference images on the equipment they actually use, and periodically cross-check decisions. When two inspectors grading the same radiographs disagree, your defect statistics are contaminated before any engineering analysis begins.
The rejection decision deserves the same rigour as the process. A pore visible on X-ray at a given size and location is evidence of a mechanism, not automatically a scrap verdict, if the specification zone permits it. Conversely, passing castings on the argument that they have always shipped — when the zone calls for a stricter class — is storing up a field failure. Keep the radiographs, keep the zone map, and make every acceptance decision traceable to both.
Reading the defect map
What teams do
- Log porosity as a scrap reason code and remelt
- Adjust pouring temperature on every new defect cluster
- Change gating, temperature and degassing in one correction
- Grade radiographs against remembered standards, per inspector
What works
- Classify morphology first: gas, shrinkage or oxide film
- Use pore position to implicate gating, feeding or turbulence
- Change one variable per iteration and keep before/after maps
- Grade against zoned reference images with cross-checked inspectors
The Economics of Rejection: Where the Money Actually Sits
Scrap cost in casting is not linear — it follows a staircase. A casting rejected after radiography has absorbed melt energy, mould or die life, inoculation and degassing consumables, and inspection time. A casting rejected after machining, where porosity breaks through on a bored surface, adds machining cost, disrupts the machining cell's schedule and often travels back as a customer charge at a multiple of internal cost. Rejected at the customer, in a pressure-tested hydraulic component, the same pore costs an order of magnitude more again.
This staircase changes your inspection strategy. It is frequently cheaper to radiograph or section a higher proportion at the foundry than to let marginal castings travel downstream, particularly for parts where porosity only reveals itself once machining opens the void. I have made this case with plant controllers more than once: the cost of an extra shot on the X-ray cabinet is trivial against a customer stoppage caused by a leak that traces back to a batch you could have caught.
Repair versus scrap is the hidden economic lever. Depending on specification and customer agreement, some porosity classes in some locations can be rectified by impregnation, weld repair or re-zoning by engineering judgement. Track the cost per rectified casting against full remelt, and track how rectified castings perform downstream. If impregnation-sealed castings never fail at the customer, that is economic data; if they fail in pressure test, that data matters even more. Decide on evidence, not on folklore about impregnation someone remembers from twenty years ago.
Building the Feedback Loop: From Defect Map to Process Change
The defect map earns its keep only when it closes the loop. Record every radiographic and sectioning finding with cavity number, position reference, defect family, size class and shift. Plot porosity frequency by position weekly, and by cavity if you run multiple-cavity dies or moulds. A single cavity drifting worse than its siblings is die or mould tooling. All cavities drifting together is melt, pouring temperature or incoming material. That differential diagnosis costs nothing beyond disciplined recording, and it is the fastest triage tool a casting quality engineer has.
A single cavity drifting points at tooling; all cavities drifting together points at the melt. That split costs nothing and diagnoses faster than any instrument.
Feed findings back into process changes deliberately, one variable at a time. Gating modification, pour temperature adjustment and degassing cycle changes all interact; if you change three at once and porosity improves, you have learned nothing transferable. Keep the before and after defect maps, compare them honestly, and retain the winning parameter set in the process documentation so the lesson survives personnel changes. An 8D without a single-variable confirmation step is a guess with paperwork attached.
Above all, treat the porosity record as an asset rather than an archive of shame. The foundry that can show a customer five years of mapped defect data, corrective actions and their measured effect is making an argument no audit checklist can replicate — and it maps directly onto what PPAP capability documentation and VDA 6.3 process audits actually ask for. The castings have been telling you what the process is doing all along. The only question is whether anybody was writing it down.
Closing the porosity loop
- 01ClassifySection or fractograph; assign the defect family: gas, shrinkage or oxide film.
- 02LocaliseOverlay pore positions on the casting drawing; identify cluster pattern by zone and cavity.
- 03DiagnoseMatch family plus position to the implicated variable: melt, gating, feeding or temperature.
- 04Correct one variableChange a single parameter; log it with the batch and shift.
- 05Verify and retainCompare before/after defect maps; document the winning parameter set.