
The escalation arrives before the root cause is understood. A key customer issues a corrective action request because their assembly line keeps stalling from erratic deliveries. Operations scrambles to expedite freight, pulling finished goods from overflow warehouses to maintain supplier scorecard ratings. The local metrics across the manufacturing footprint all show green. The network is failing.
When we trace the breakdown backwards, the gap between the customer's need and the plant's rhythm widens with every operational layer. The customer demands a steady pull of mixed variants. The logistics team ships in emergency batches. The plant manager celebrates record machine throughput. The shift supervisor struggles with severe cycle-time spikes. The operators build to different standards.
Across two decades in automotive and aerospace, I have audited plants where local efficiency figures looked flawless while the network starved. The mathematical simplicity of takt time collides with the operational reality of scale. The calculation is trivial; managing the variables that disrupt it is the engineering work. Walking the failure back from the loading dock to the initial demand calculation reveals where the synchronisation breaks.
The Delivery Consequence: Erratic Supply and Expedited Freight
The customer experiences the failure as unpredictable supply. They place levelled orders for two hundred units of variant A, one hundred and fifty of B, and one hundred of C across a shift. Instead of receiving a smooth flow every minute, they receive surges of variant A, a dead silence while the plant changeovers, and a panicked rush of variants B and C shipped via premium air freight. The margin on the ordered products vanishes.
Tracing this back to the plant floor, the immediate trigger is chronic overtime. The line misses its daily production plan by forty minutes, and supervisors extend shifts to recover the gap. This overtime is not caused by unmotivated operators. It is the physical manifestation of a line trying to sustain a rhythm it mathematically cannot achieve.
The plants hit their local efficiency targets, but the customer experiences chronic shortages. The immediate response is usually to add inventory buffers. Instead of synchronising the manufacturing pace, the plant builds a wall of finished goods to mask the variance. The warehouse fills with the wrong configurations, and capital ties up in unsaleable stock while expedited freight costs spiral out of control.
The Floor Symptom: Cycle-Time Spikes and Process Drift
Walking onto the floor, the symptom presents as severe work-in-process accumulation at specific stations. A workstation designed for a forty-second cycle suddenly spikes to seventy-five seconds when variant C enters the queue. The operator rushes, quality drops, and the downstream stations sit idle waiting for the bottleneck to clear. The takt window shatters repeatedly throughout the shift.
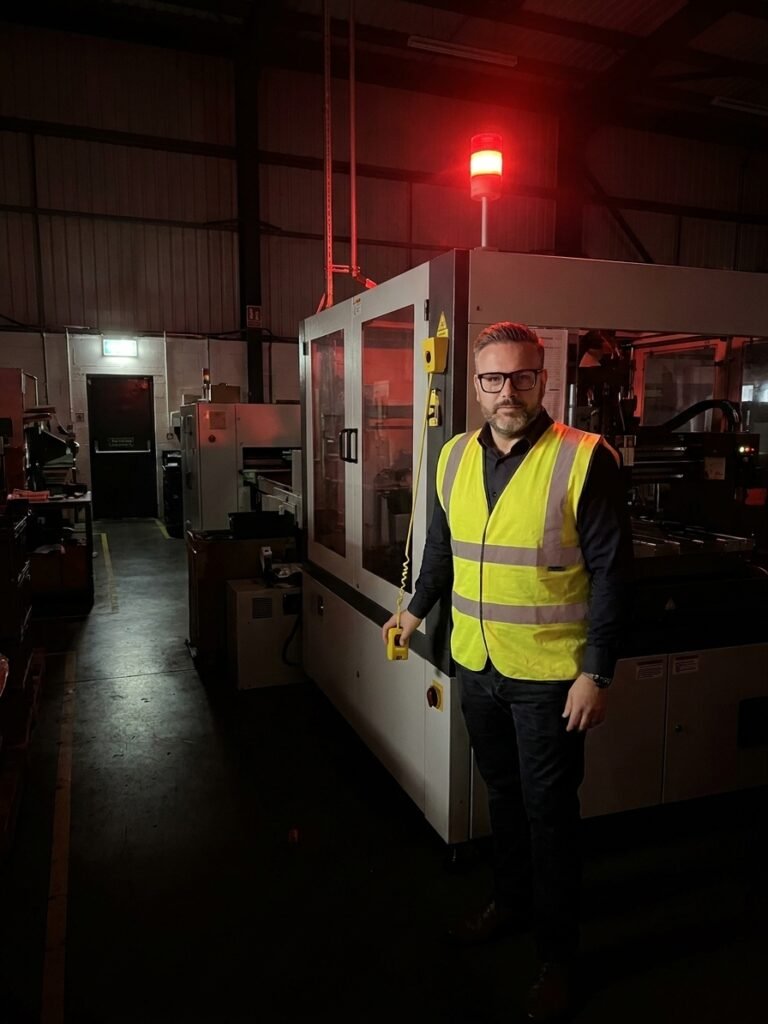
When a station constantly exceeds the planned takt, management often assumes operator performance is the problem. They implement stricter supervision or incentive schemes. But when you time the operation thirty times with a stopwatch, the data exposes the truth: the work content varies wildly between variants, and the station physically cannot absorb the heaviest configuration within the allocated seconds.
This floor-level chaos is the direct result of absent production levelling. Without heijunka sequencing, lines batch-build variant A until changeovers consume the shift. The standardised work documentation either does not exist or is treated as a suggestion rather than the baseline. Operators develop individual motion sequences, introducing fifteen to twenty seconds of variance per cycle at high volume.
The Planning Fallacy: Nameplate Capacity Versus Net Productive Time
The decision that guarantees this floor-level failure is made in the planning office. It is the calculation of takt time against gross available time rather than net productive time. A shift offers 28,800 gross seconds. After breaks, meetings, and start-up procedures, 26,400 seconds remain. Planners frequently anchor the line's rhythm to this gross figure, assuming the equipment will run uninterrupted.
But available time is not productive time. If your overall equipment effectiveness (OEE) sits at seventy percent, you do not have 26,400 seconds of output. You have roughly 18,480 seconds of reliable, value-added production. Calculating takt against the higher number embeds a structural defect into the schedule. The line starts every shift with a mathematical deficit it cannot outpace.
At low volume, this miscalculation hides behind safety stock. The line produces scrap or suffers micro-stoppages, but the warehouse absorbs the variance. When volume scales or the customer pulls faster, the buffer drains. The root cause was never operator performance or sudden machine unreliability. It was a takt time calculated against theoretical time that the equipment cannot physically deliver.
The OEE Reality Gap
The Network Disconnect: Uncoordinated Local Optimisation
In multi-site operations, the post-mortem reveals another layer of failure: independent local optimisation. A tier-one supplier running plants in different regions shares a single customer order book. Plant A builds at a 45-second takt. Plant B runs the same product at a 65-second takt. Both facilities hit their internal performance targets, but the customer receives an erratic, unpredictable supply.
This happens because each plant calculated its takt based on local efficiency metrics and machine capability. Plant B's equipment is older and runs slower, so local management relaxed the rhythm to hit their numbers. They ignored the fundamental rule: takt time is the customer's voice translated into seconds. When you change the number to suit your machinery, you are ignoring the customer.
Takt time is the customer's voice translated into seconds. When you change the number to suit your line, you are ignoring the customer.
Network-level synchronisation requires a central planning function that dictates the rhythm across all sites. If the equipment cannot achieve the required cycle, you either invest in upgrades or assign that product family to a different facility. You cannot paper over physical capability differences with optimistic scheduling. Cross-site process audits must verify that each location holds the identical standard.
Rebuilding the Calculation: The Corrective Sequence
Correcting the failure requires recalculating the rhythm from the customer backwards through the entire value stream. Measure the actual OEE over a representative period of at least thirty shifts. Multiply available time by that factor to establish net productive time. Only then calculate the takt. If the resulting rhythm is too fast for the line to sustain, you have exposed a capacity shortfall that requires engineering intervention, not schedule manipulation.
Once the takt reflects reality, you must sequence the variants. Implement heijunka logic to level the mixed-model flow. Instead of batch-building variant A until the changeover disrupts the shift, sequence the variants in small, repeating intervals. This smooths component consumption at the material feeders and stabilises the cycle times at each station. The takt remains constant; the work content simply changes with each unit.
If the net productive calculation exposes a bottleneck, you must rebalance the line. Split the constrained operation into parallel stations or redistribute tasks to underutilised cells. I have reviewed automotive lines where splitting a 78-second bottleneck into two 42-second parallel stations dropped the maximum cycle time to 65 seconds, comfortably below takt. Overtime vanished, and the line absorbed the scaled volume without additional labour.
Takt Recovery Sequence
- 01Define Net Productive TimeMeasure actual OEE over 30 shifts; multiply by available time, not nameplate capacity.
- 02Calculate Combined TaktApply the true customer demand figure across all variants to the corrected net time.
- 03Level the Mixed-Model FlowImplement heijunka sequencing to prevent variant batches from destabilising station cycles.
- 04Balance and StandardiseRedistribute work content from constrained stations and lock the motion sequences.
- 05Validate Across the NetworkConfirm the rhythm holds identically at every site producing the family through cross-audits.
Enforcing the Rhythm: Visibility Before Digital Complexity
Fixing the calculation is useless if the floor cannot see it. Every station needs a real-time display showing the target takt, the actual cycle time, and the cumulative variance for the shift. A single andon board at the end of the line is insufficient. Operators must see immediately when a cycle exceeds the window so they can trigger support before the backlog compounds and the daily plan collapses.
Technology does not replace operator understanding. Present the data in a format the shop floor can act on: a simple red-green indicator against takt, not a dashboard of OEE fractions. If the standardised work documentation does not match the actual motions on the floor, the digital system merely highlights the failure faster. The discipline of standardised work comes first; the technology reinforces it.
Standardisation must cross plant boundaries. If two facilities produce the same component, their work sheets must be identical. Variations in tooling may force minor adaptations, but the core motion sequence and cycle time must match. Without this baseline, network-level takt synchronisation is impossible. When the calculation is correct, the sequence is levelled, and the visibility is real, the line synchronises to demand without constant managerial intervention.