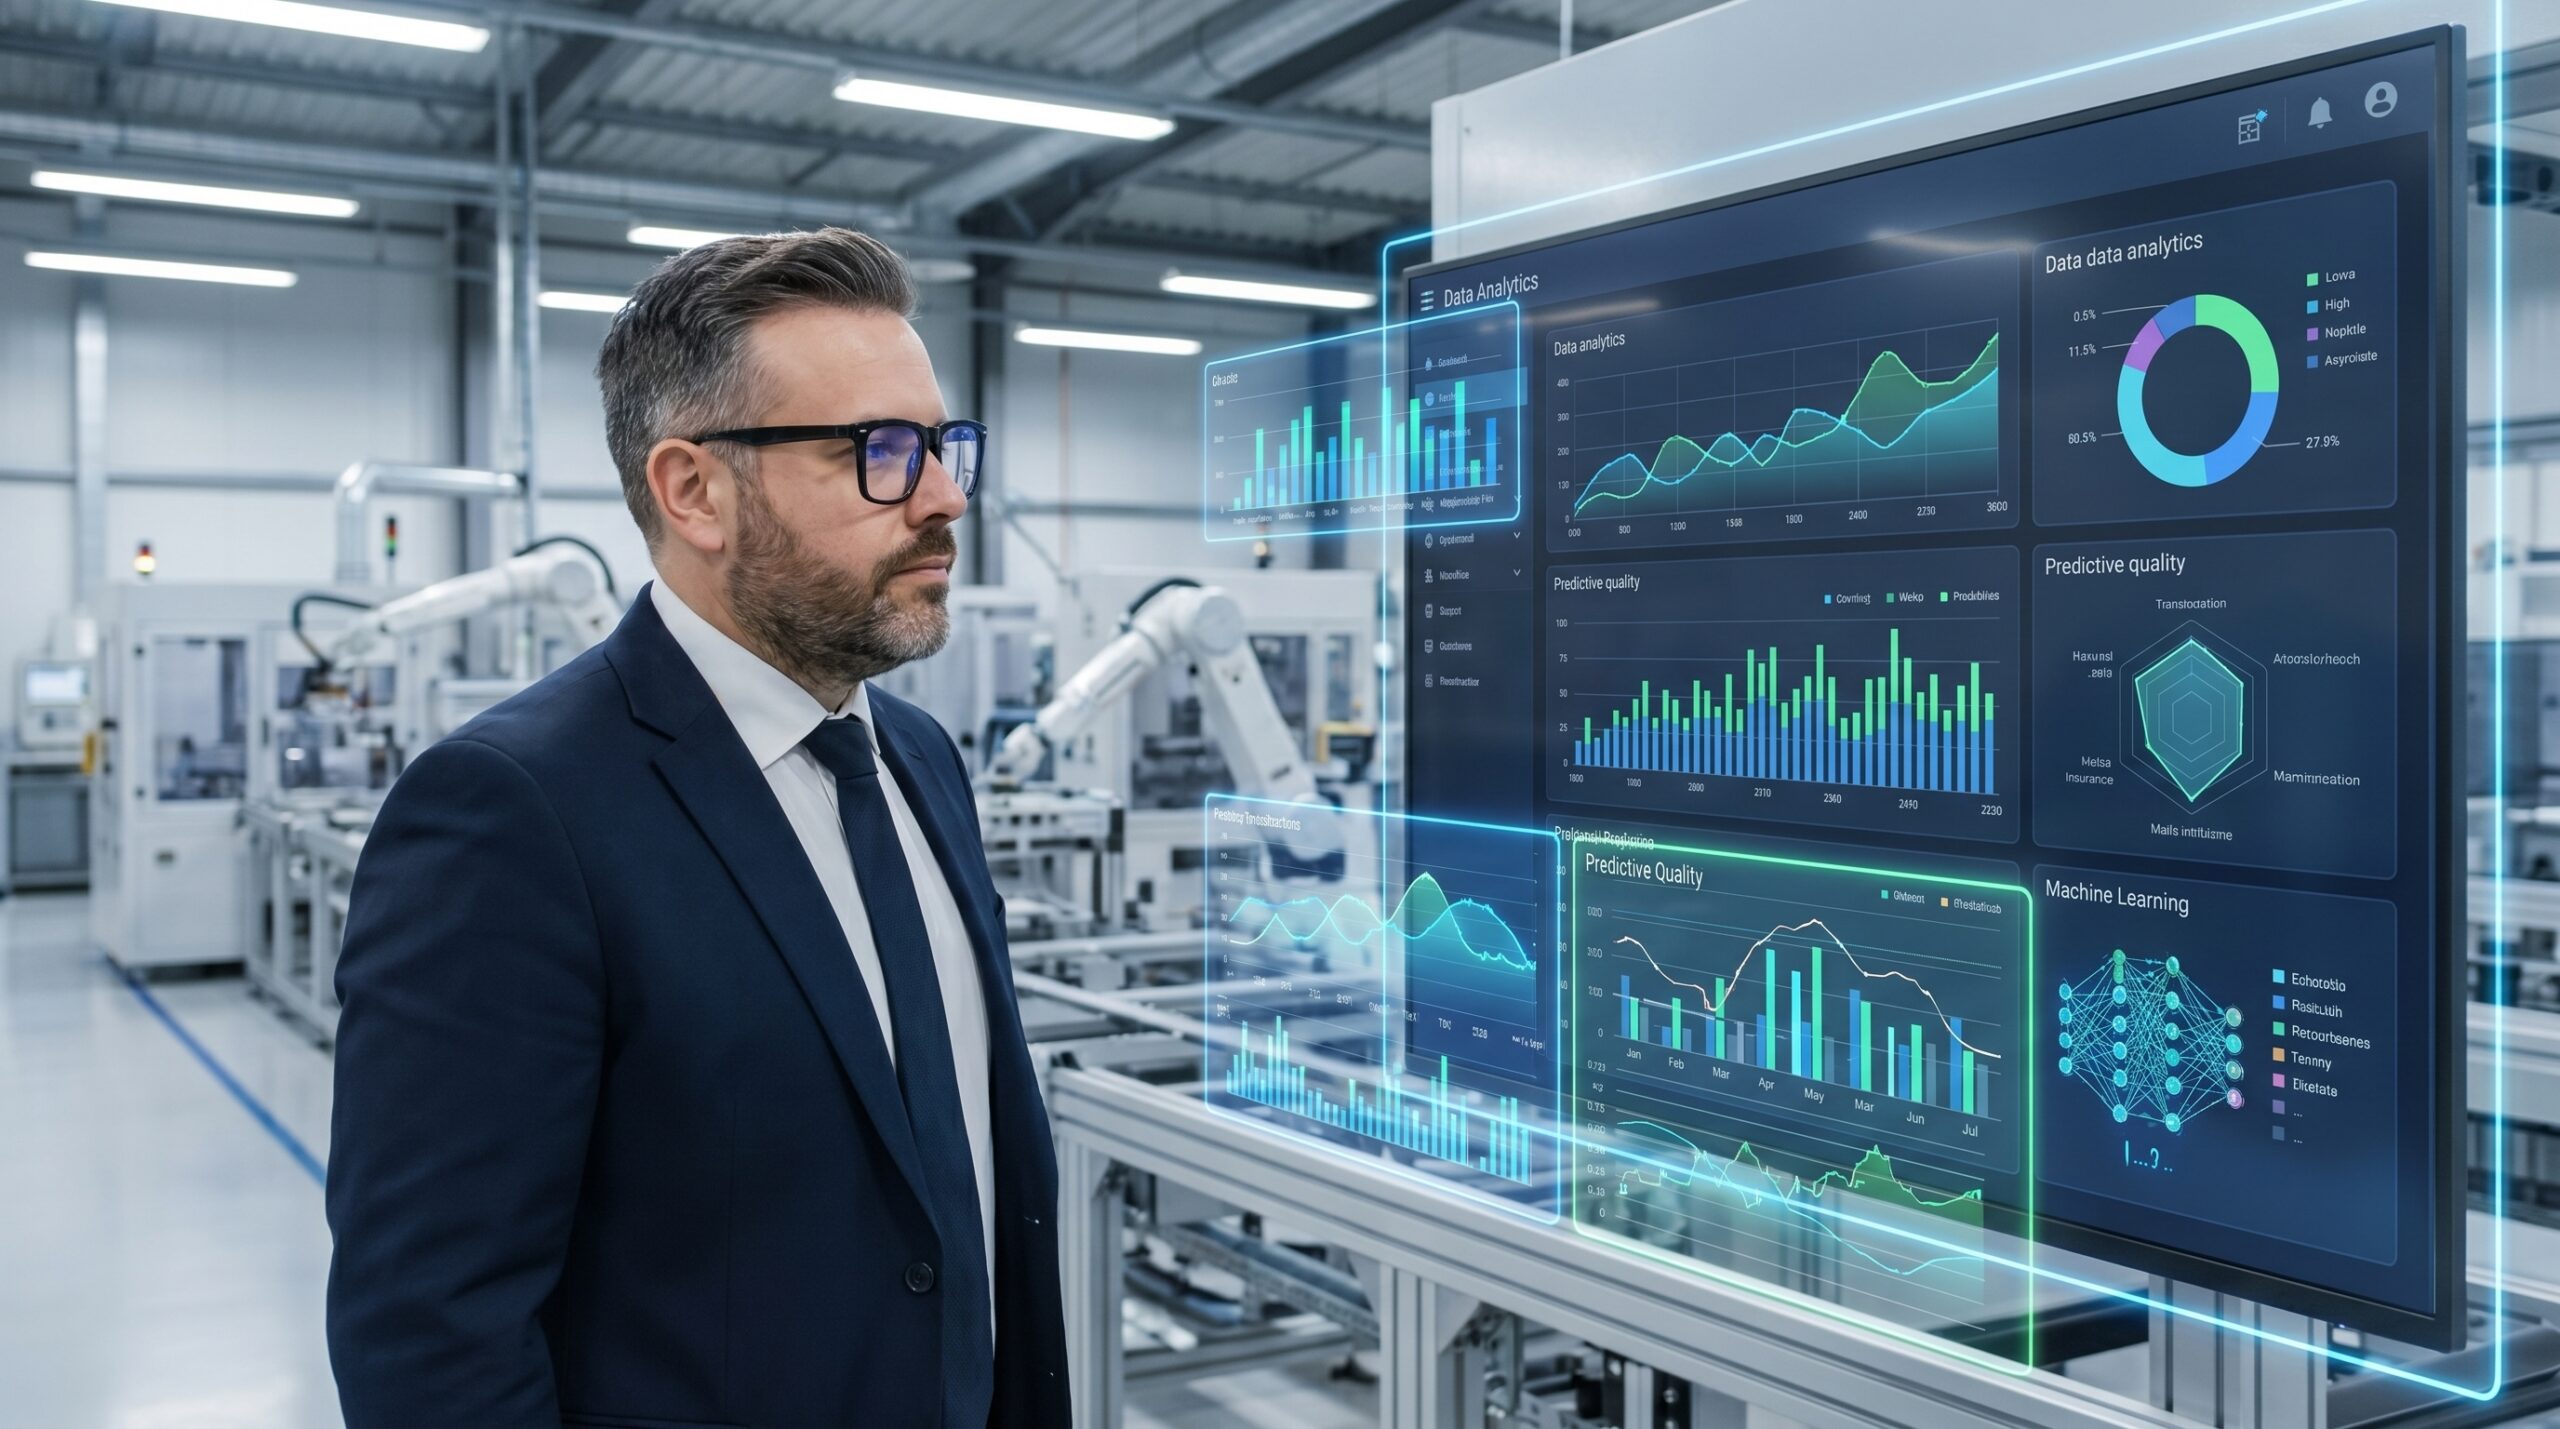
In November 2024, a quality director at a Central European automotive supplier stood in front of a board covered in red dots. Each dot represented a defective part. Scrap had risen 37% over the previous month. The traditional SPC charts were green. The control plan was being followed. Reaction plans had been executed. Quality was still dropping.
Traditional quality tools are excellent at capturing what has already happened. They tell you nothing about what will happen in the next two hours. That gap is where modern manufacturing either builds a competitive edge or begins a slow decline.
I have audited plants where the entire quality system is essentially a highly refined rear-view mirror. When a point crosses a control limit on an SPC chart, the process has already produced defective parts. When a sample fails inspection, the batch is already compromised. The system is fundamentally reactive. Predictive quality, driven by machine learning (ML), changes that paradigm by identifying the conditions that lead to drift before the drift occurs.
What Machine Learning Actually Does in Quality
Machine learning is a subset of artificial intelligence that enables systems to learn from data without being explicitly programmed for every scenario. In a quality context, an algorithm analyses thousands of data points from your manufacturing process to find patterns that standard statistical methods cannot.
Consider an injection moulding process. A mould temperature of 182°C, combined with a material moisture level of 2.3%, an injection pressure of 1,450 bar, and an injection speed of 85 mm/s produces microscopic porosity in 73% of parts—but only after 340 cycles. No Ishikawa diagram will surface that multi-variable relationship. Standard ANOVA will miss it under normal parameter ranges. A trained ML model will flag it within hours of processing historical data.
Three Predictive Models for the Shop Floor
Not every process requires the same analytical approach. The model you deploy depends on the question you need the system to answer.
1. Classification: Will the part be good or bad?
The most common deployment. The model learns from historical data to distinguish between conforming and nonconforming production based on input parameters. In a press shop producing body panels, the model analyses press force, speed, tool temperature, and sheet thickness. It predicts in real time that a specific cycle has a 92% probability of producing a part with excessive waviness. The operator receives the signal and adjusts parameters before the sheet even enters the die.
2. Regression: What will the exact value be?
Instead of a binary outcome, the model predicts a specific quality value. It might project that under current settings, the surface roughness will measure Ra 1.68 μm. If the specification demands Ra ≤ 1.6 μm, you know you are on the edge and can intervene. This approach is critical in processes with slow feedback loops, where quality measurement takes hours or days—metallographic testing, fatigue testing, or long-term stability verification.
3. Anomaly Detection: Something is wrong
The model learns what a normal operational state looks like across the entire process. It raises an alarm when the system behaves abnormally, even if no individual parameter has breached its control limit. It functions like an experienced operator who senses something is wrong despite all gauges reading green—but with the precision and speed a human cannot sustain over a full shift.
Deploying ML: A Five-Layer Architecture
Implementing ML in quality is not a question of writing a single algorithm. It is a system engineering project. Underestimating the infrastructure is the most common reason these initiatives fail.
Architecture of a Predictive Quality System
- Monitoring & RetrainingModels degrade as tools wear and materials change. Automated retraining on fresh data keeps predictions valid.
- Validation & DeploymentHold back 20-30% of data for testing. Confirm the model learned actual patterns, not memorised noise.
- Model Selection & TrainingStart simple. Random Forest handles non-linear relationships robustly. Reserve neural networks for image data.
- Data Cleaning & PreparationReality is messy: missing values, sensor dropouts, unlogged tool changes. This consumes 60-70% of project time.
- Automated Data CollectionCycle-synchronised PLC/SCADA data paired with quality control feedback. Without this, there is no prediction.
A Practical Deployment Case
The automotive supplier mentioned earlier targeted one critical process: injection moulding of connector terminals for a cable harness. The team spent three months gathering data across 12 process variables—including mould temperature, melt temperature, holding pressure, cooling time, and environmental humidity.
After 14,000 cycles, they had a viable dataset. A Random Forest model trained on that data predicted defective parts with 87% accuracy—45 minutes before the injection cycle even began. Instead of stopping the line, sorting parts, and opening an 8D investigation, the operator received a proactive HMI prompt: risk of incomplete fill detected, increase melt temperature by 3°C. Over three months, scrap on that process dropped by 62%. They did not react faster. They reacted before there was anything to react to.
SPC tells you if a process is stable. Machine learning tells you if it will destabilise in an hour. You need both.
Compliance and Common Failures
A persistent myth in highly regulated industries is that ML represents an un-certifiable black box. The reality is more straightforward. ISO 9001 and IATF 16949 do not require every tool to be fully transparent, but they do require you to prove that the tool works. Model validation, statistical measurement of accuracy, and documented results for data retention are all standard requirements that ML systems can meet.
The most dangerous failure is assigning ML ownership to the IT department. ML in quality must be owned by the quality team. IT provides the infrastructure. Defining objectives, selecting variables, interpreting results, and validating predictions against physical reality—these are the domains of a quality engineer who understands the process.
Attempting to replace SPC with ML is equally dangerous. ML cannot substitute for control charts. SPC is the foundation. ML is the predictive layer built on top of it.
Implementation Roadmap and Return
Start with one critical process that drives the highest scrap cost or complaint rate. Verify you have at least six months of historical data. Find a partner who understands manufacturing first and algorithms second.
Expected Pilot Project Metrics
From Prediction to Optimisation
Current ML models predict what will go wrong. The next phase is closed-loop optimisation, where the system automatically adjusts machine parameters to prevent the predicted defect from ever forming. This moves manufacturing toward genuine zero-defect production—where nonconforming parts are never created, not just caught at inspection.
The supplier who stood in front of that board of red dots now monitors a real-time dashboard tracking the health of his critical processes. The red dots are gone, replaced by predictive bands showing expected process behaviour for the next two hours. He is no longer driving by the rear-view mirror.