A doctor in an emergency room does not prescribe antibiotics the moment a patient reports a cough and chest pain. They build a differential diagnosis: a structured list of probable conditions, from pneumonia to pulmonary embolism, and order specific tests to eliminate possibilities one by one until the true disease is confirmed. Only then do they prescribe a targeted treatment.
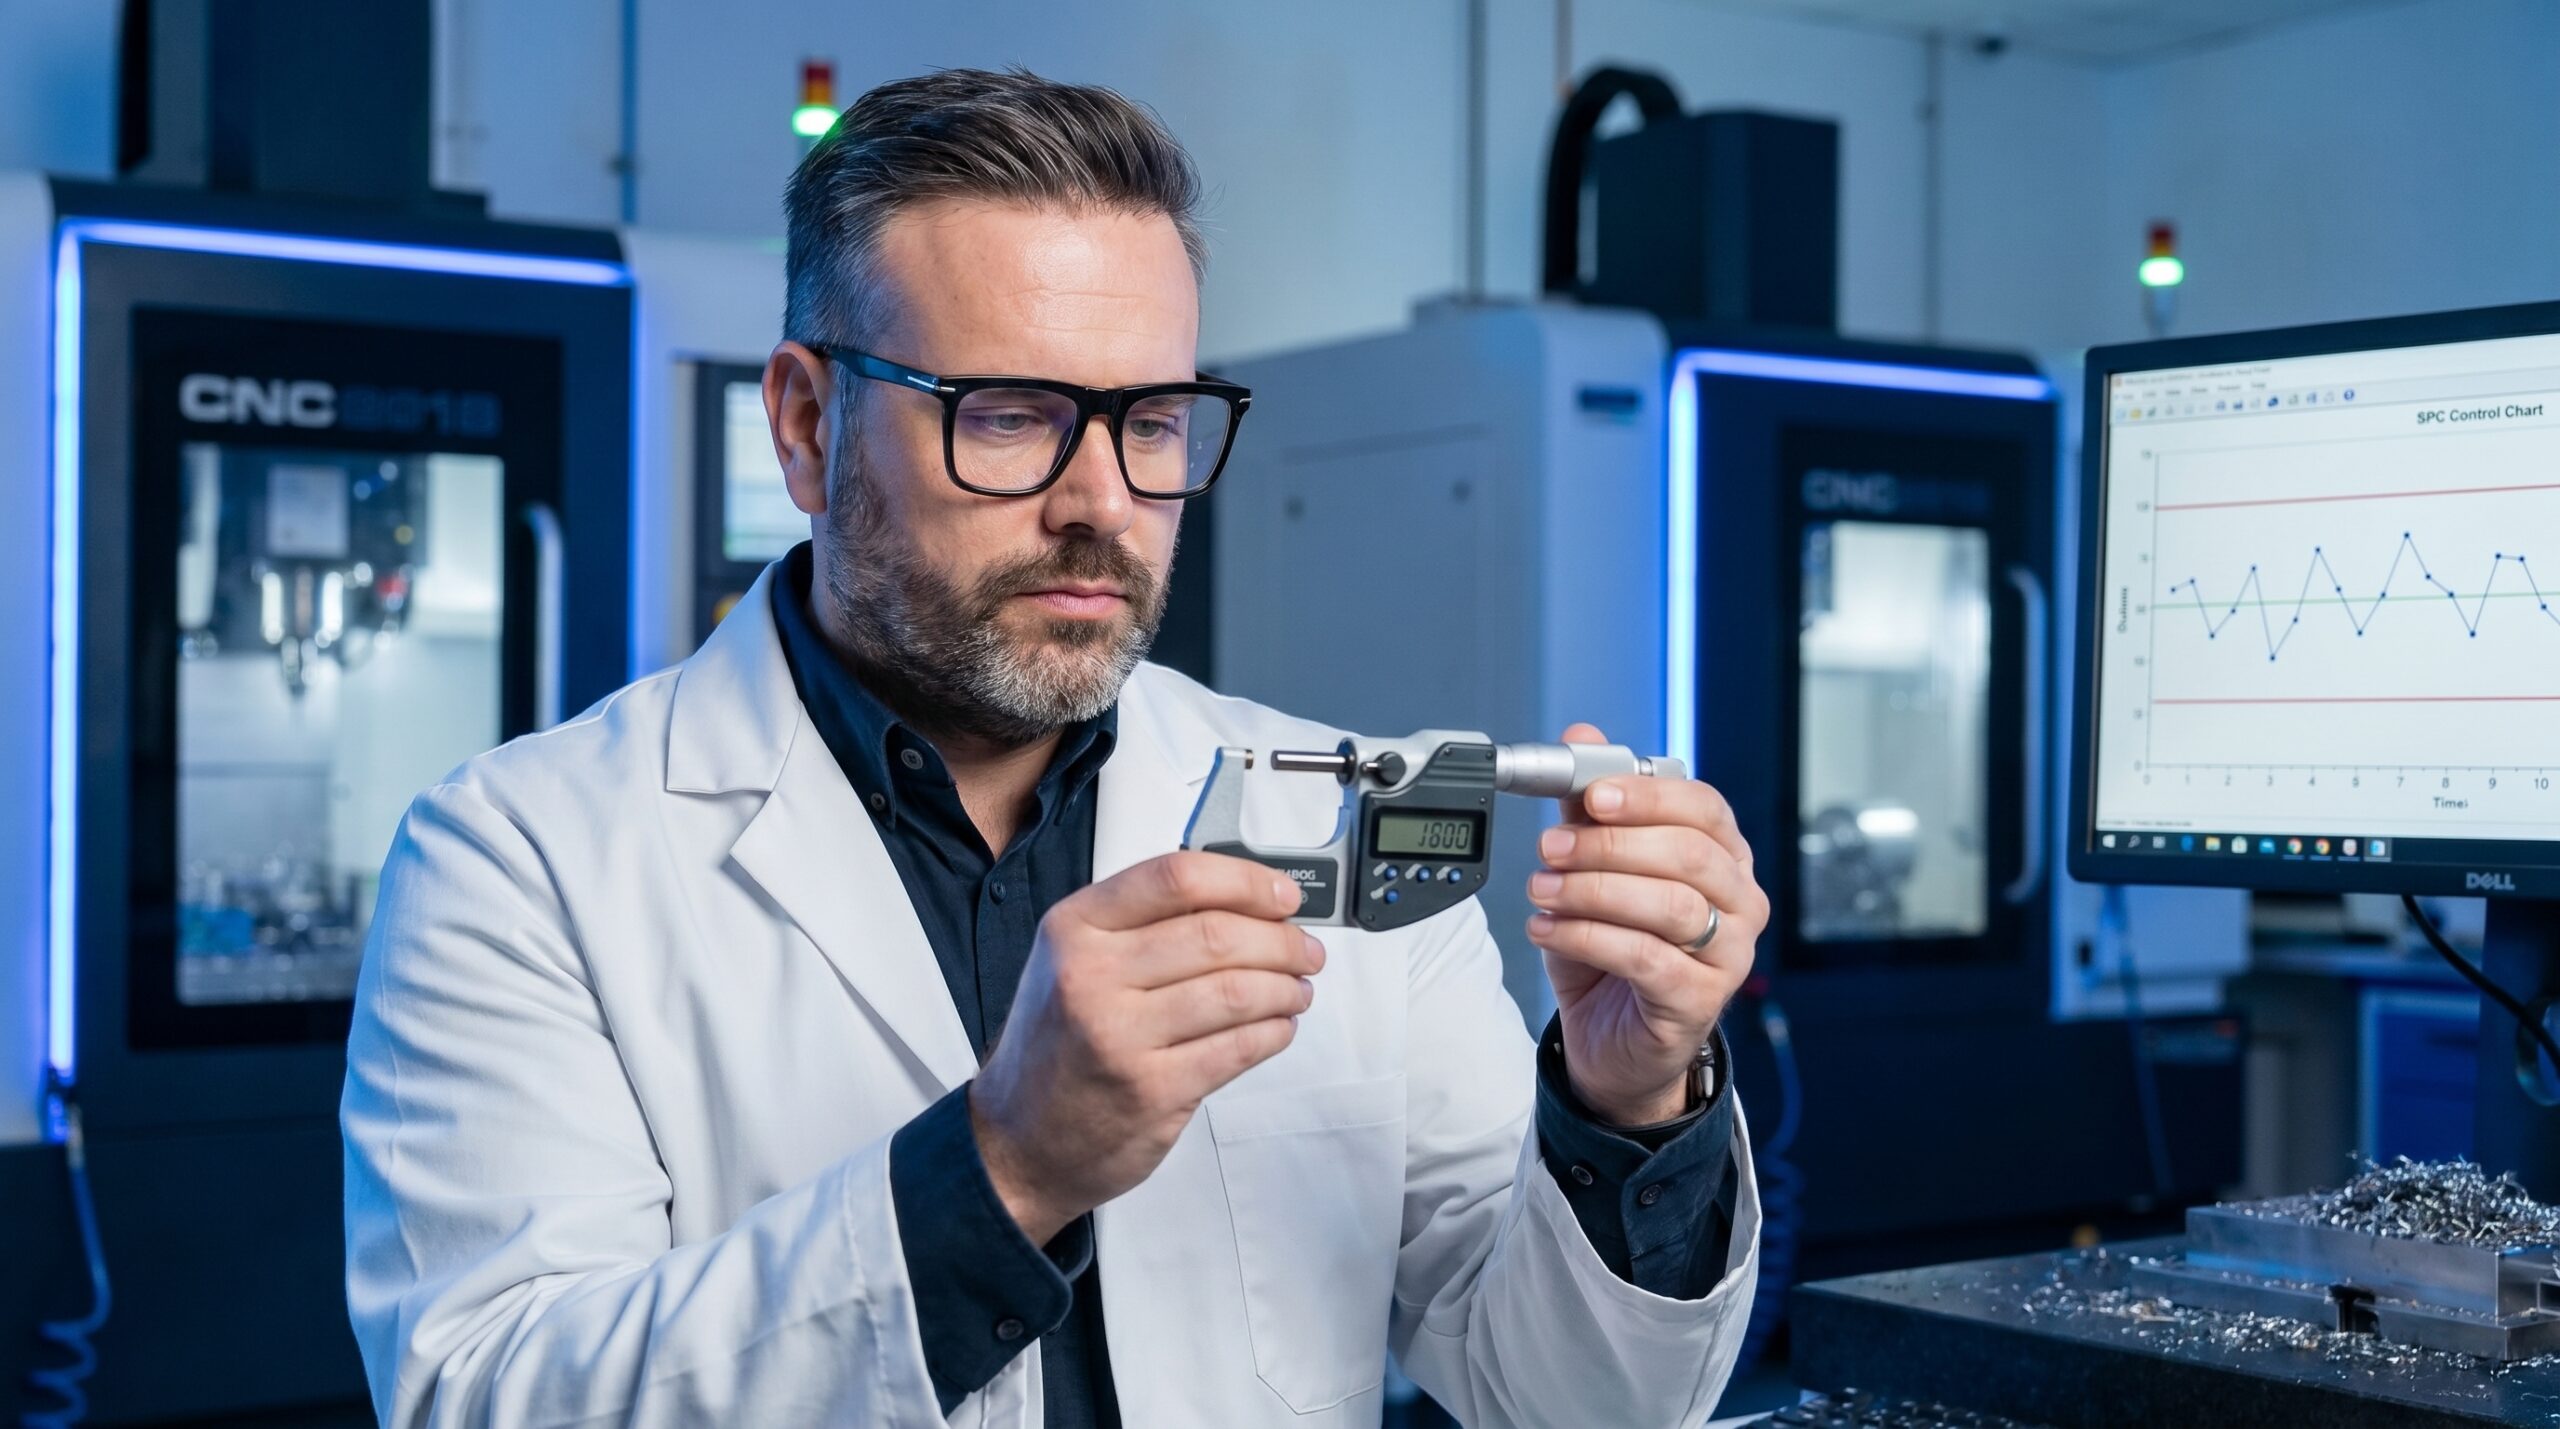
Manufacturing teams routinely skip this diagnostic phase. When a critical dimension drifts out of specification, the standard operating procedure is often trial and error. Teams change the tool, adjust the CNC feed rate, or switch material suppliers based on gut feeling. When the defect rate remains unchanged, frustration builds and operators lose confidence that the issue can actually be resolved.
I encountered this exact scenario at a precision automotive plant plagued by a 12% defect rate on a critical groove depth. The team had spent six months swapping out tools and changing material suppliers. By applying the medical differential diagnosis framework to their production line, we isolated the true variable and eliminated the defect in under a week.
Building the Quality Anamnesis
In medicine, every diagnosis begins with an anamnesis: a thorough patient history. The doctor asks when the symptoms started, what exacerbates them, and whether there is a historical pattern. In quality engineering, this is our data collection phase. Before formulating any hypotheses or testing any solutions, we must define the exact boundaries of the failure mode.
A proper manufacturing anamnesis relies on temporal analysis and stratification. We must determine whether the defect is continuous or intermittent, map it against specific shifts, and identify if it correlates with machine cycles, operator changes, or raw material batches. Defining the scope—how many parts are affected and whether the defect spans multiple dimensions—isolates the variables.
At the automotive plant, the anamnesis quickly revealed that the groove depth failures were intermittent, spiking on Tuesdays and Thursdays, and predominantly during the afternoon shift. These data points were the clinical symptoms required to move forward, proving that random tool changes would never reveal the underlying condition.

Constructing the List of Differential Diagnoses
The core of the DDx method is building a comprehensive list of all plausible root causes before attempting any fixes. Instead of jumping on the first theory that sounds plausible, the team brainlists every potential failure mechanism. This includes obvious operational variables, material inconsistencies, environmental factors, and complex interactions between different process steps.
Each hypothesis must be structured as a testable statement. For the automotive groove depth issue, we listed material hardness variations from different suppliers as highly probable, followed by thermal expansion of the machine spindle, fixture clamping errors, and measurement methodology discrepancies on the night shift.
A critical rule during this phase is to never discard a possibility too early. Medical training dictates that when you hear hoofbeats, think of horses, not zebras. In quality engineering, you test the standard suspects first, but you must keep rare failure modes—like specific CNC software interpolation bugs or nonlinear humidity interactions—on the board until actively disproven.
Designing Tests for Systematic Exclusion
With the hypotheses mapped, the next step is designing tests specifically to confirm or exclude each condition. The goal is not to implement a fix, but to generate decisive data. We prioritise tests that eliminate multiple hypotheses simultaneously, saving time and resources while systematically narrowing the field of potential root causes.
We tested the material hypothesis by machining parts from Supplier A and Supplier B under identical conditions. The results showed no statistically significant difference in groove depth variability. The material hypothesis was confidently excluded in two days, saving the plant from another months-long supplier qualification process.
Next, we tested the thermal hypothesis. We installed sensors to log ambient hall temperature, coolant flow, and spindle temperature in real time. The ambient temperature rose from 20°C to 27°C during afternoon shifts, driving the spindle temperature up to 35°C. The correlation between spindle temperature and dimensional deviation was a strong 0.87, flagging a prime suspect that required causal verification.
The Systematic Exclusion Process
- 011. Collect AnamnesisGather data on symptoms: timing, frequency, affected dimensions, and shift patterns.
- 022. Map HypothesesBuild a comprehensive list of all possible root causes, ranked by probability.
- 033. Execute Exclusion TestsDesign specific trials to systematically confirm or eliminate each hypothesis.
- 044. Verify CausalityRun a causal test to prove the variable directly creates the defect.
- 055. Implement TreatmentApply the targeted corrective action strictly to the verified root cause.
Verifying Causality, Not Just Correlation
Correlation does not equal causation. Spindle temperature highly correlated with the dimensional failures, but treating correlation as fact is a common quality engineering trap. To prescribe the correct corrective action, we needed to prove that spindle temperature was the direct physical cause of the groove depth deviation, not merely a coincidental metric alongside another hidden variable.
Until you control the variable and intentionally force the failure, you only have a suspicion, not a diagnosis.
We ran a definitive causal test over a weekend and the following Monday. We produced 200 parts on Sunday at a stable 20°C ambient, another 200 on Monday morning, and a final batch on Monday afternoon when the hall reached 27°C. For the final batch, however, we applied active cooling to maintain the spindle at a constant 22°C.
The Sunday and Monday morning batches yielded 0% defects. The Monday afternoon batch, despite the sweltering factory floor, also yielded 0% defects because the spindle temperature was strictly controlled. The diagnosis was absolute: thermal expansion of the spindle was disrupting the tool offset.
Targeted Treatment and Control Plan Integration
With a confirmed diagnosis, designing the corrective action is straightforward. We did not waste resources chasing material variations or retraining operators. We installed an active spindle cooling system with thermostatic regulation to maintain a constant temperature regardless of ambient factory conditions.
We also updated the CNC programme with a temperature compensation algorithm that automatically adjusts tool offsets based on real-time spindle data. To close the loop and satisfy IATF 16949 requirements, we updated the PFMEA and control plan, and added a live temperature monitoring graph to the Andon board for operator visibility.
The scrap rate dropped immediately from 12% to 0.3%. The entire fix cost a few hundred euros for the cooling apparatus and two days of engineering time. The plant had spent six months and significantly more capital blindly changing tools and suppliers, attacking symptoms instead of the disease.
Diagnostic Methodologies in Quality Engineering
Standard Root Cause Analysis
- Utilises 5-Why and Ishikawa diagrams for straightforward defects.
- Effective for isolated, repeating failures with obvious mechanisms.
- Relies heavily on operator experience and immediate process observation.
- Breaks down when multiple overlapping variables mask the true trigger.
Differential Diagnosis (DDx)
- Designed for chronic, intermittent issues that evade standard RCA.
- Maps all potential variables before any physical changes are made.
- Employs structured testing to actively eliminate impossible causes.
- Requires definitive causal proof before corrective action is implemented.
Institutionalising the Diagnostic Framework
To implement this methodology across an organisation, quality leaders must enforce a strict cultural shift: no corrective actions without a verified diagnosis. Teams must learn to resist the urge to jump straight into the 8D containment phase with untested solutions. Taking three days to diagnose saves months of recurring scrap and failed corrective actions.
Create a standardised DDx template for the quality management system. The single-page form should flow logically: problem description, recorded symptoms, comprehensive hypothesis list, test designs, elimination results, confirmed diagnosis, and validated solution. This formal structure forces discipline and prevents the team from drifting back into reactive troubleshooting.
Differential diagnosis transforms your 8D reports from documents of guesswork into precise engineering records. By adopting a systematic medical approach to defect reduction, you eliminate the cycle of frustrated trial and error, ensuring that your corrective actions permanently resolve the actual root cause.