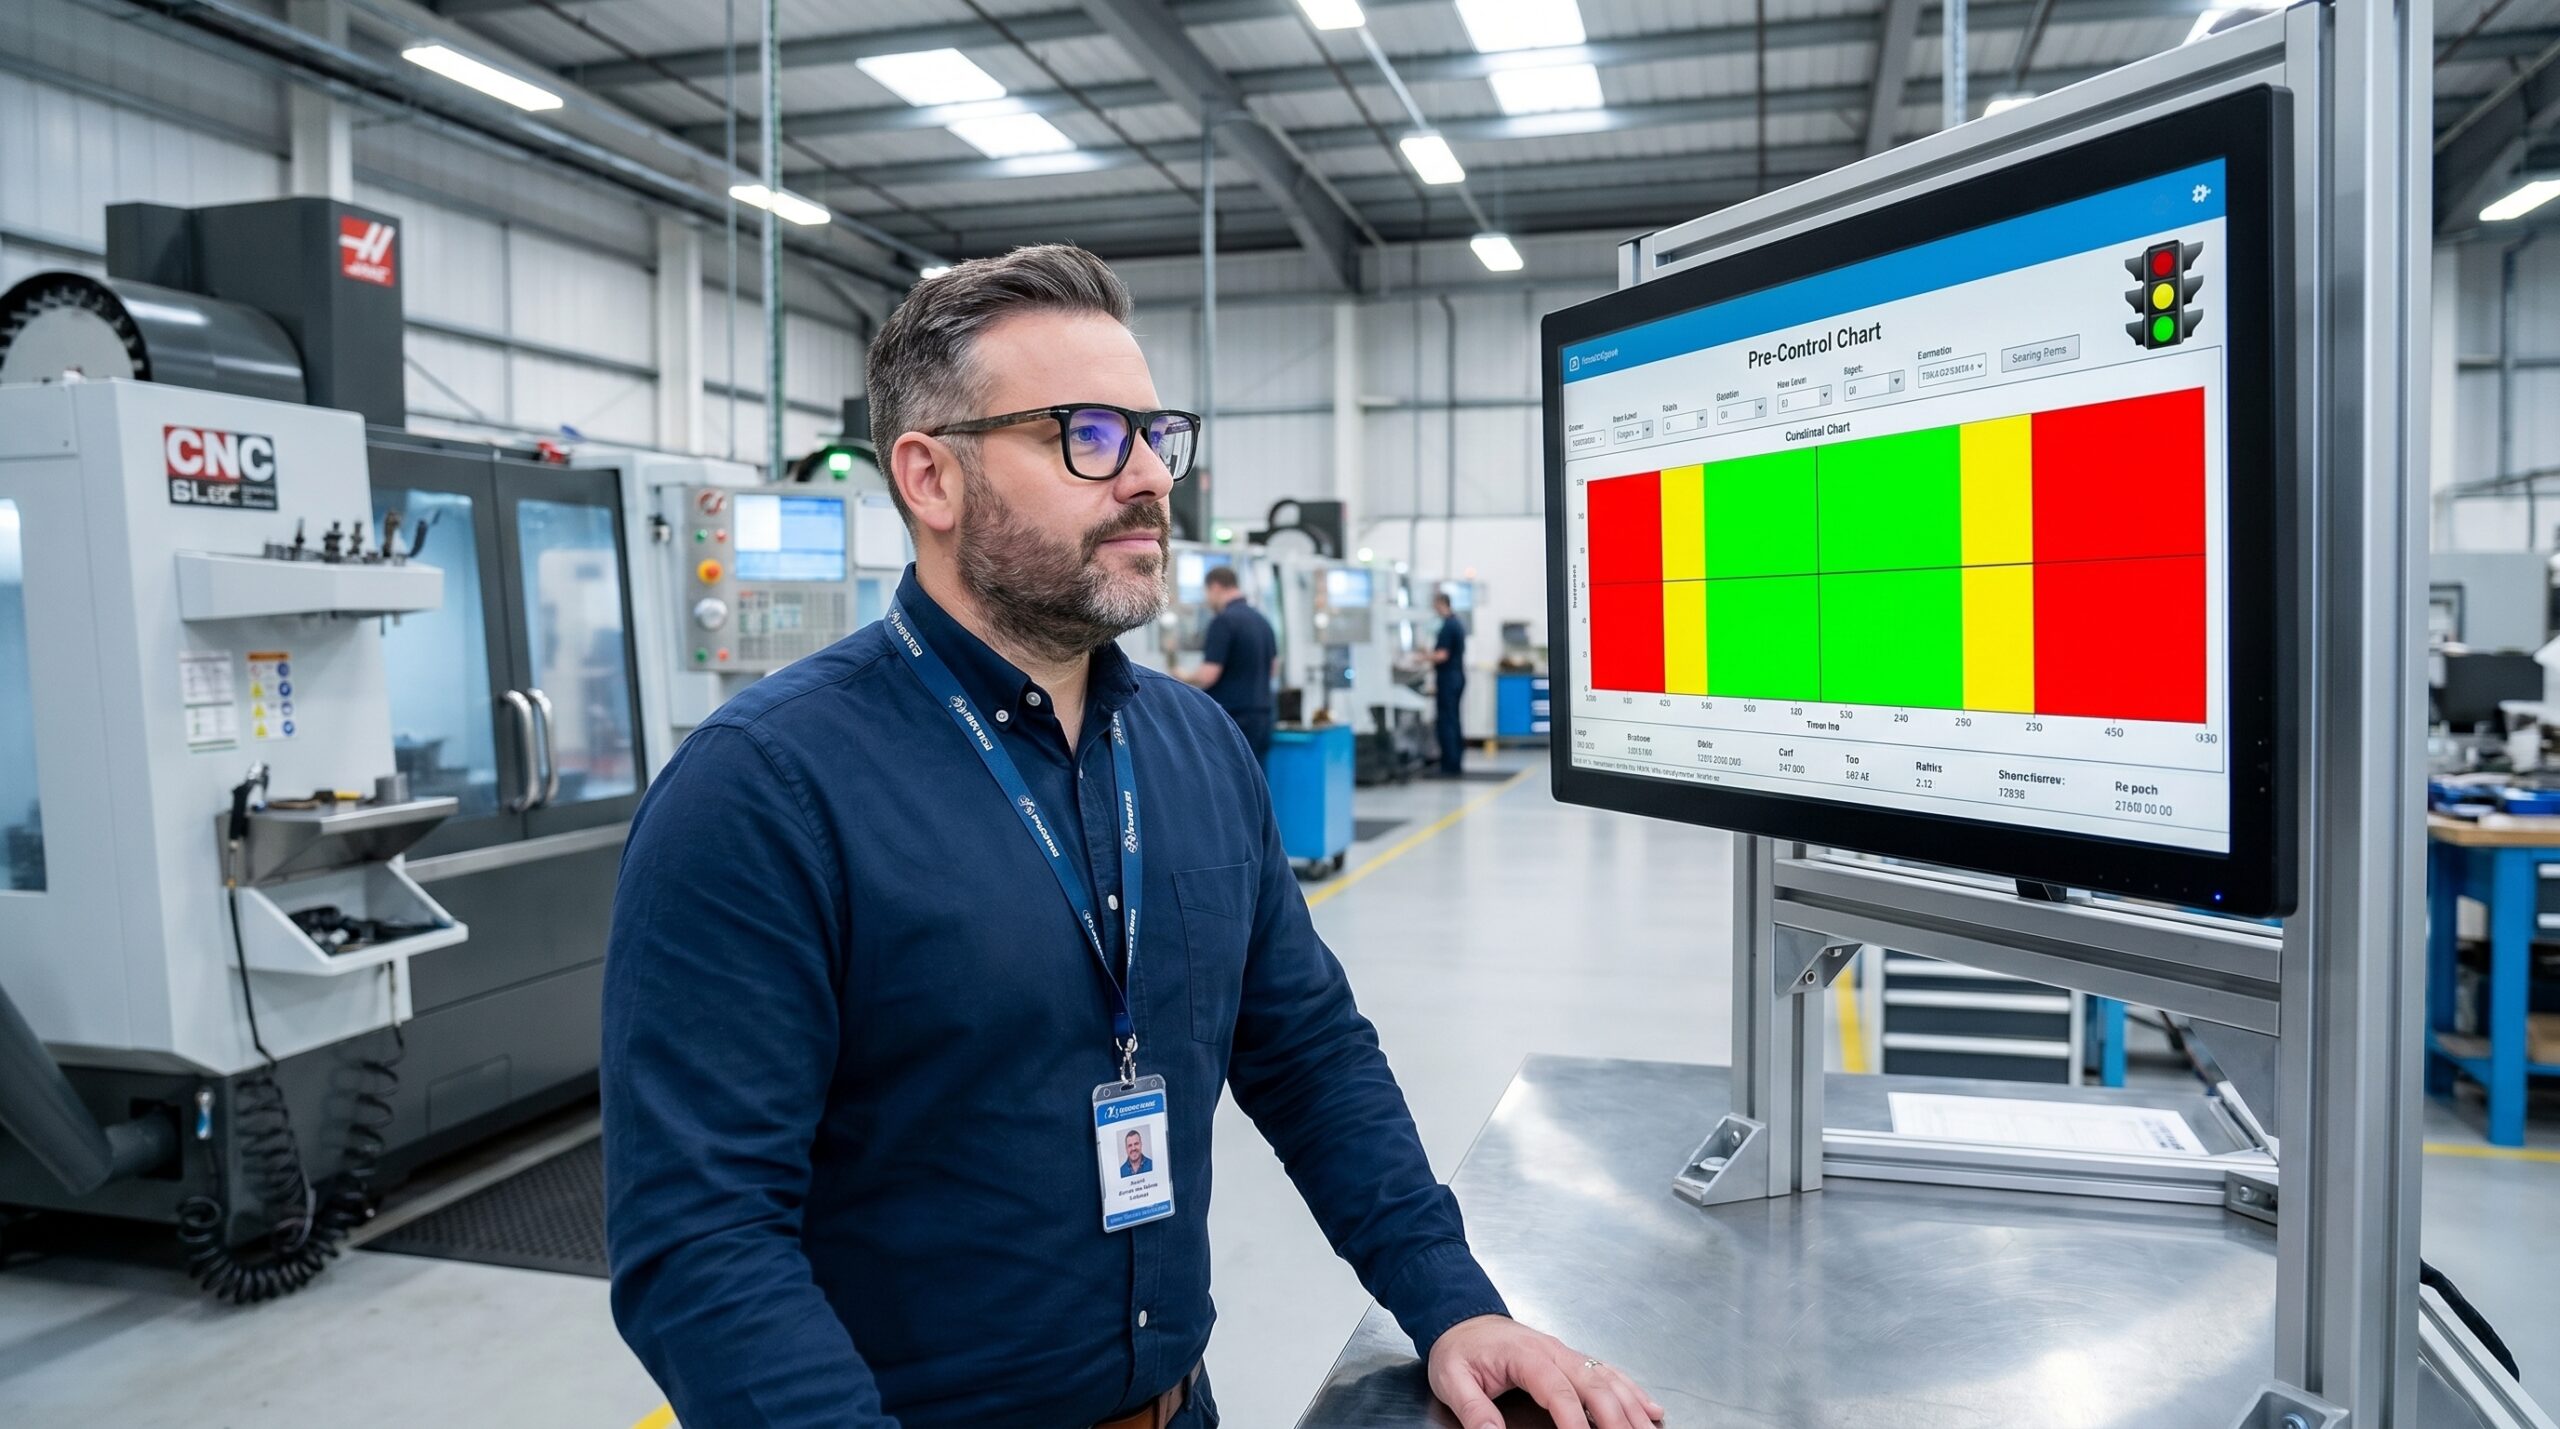
Most statistical process control fails on the shop floor because it demands statistical interpretation from operators who have 15 minutes of SPC training and a cycle time measured in seconds. Pre-Control solves this. It maps the tolerance band into three visual zones and replaces calculation with a binary instruction: run or stop.
I first encountered Pre-Control at a precision machining plant supplying automotive components. Every gauge station had a coloured wheel mounted on it — green, yellow, red. The production lead called it their traffic light. There were no control limits, no sigma calculations, no Western Electric rules. Operators measured parts, compared the result to coloured zones, and acted. The system was running at Cpk 1.33 with near-zero escape rate on critical characteristics.
That plant was not behind the curve. It was using the right tool for the right person.
What Pre-Control Actually Is
Pre-Control divides the specification tolerance — not calculated control limits — into three zones. The green zone sits between half the tolerance on either side of the nominal. The yellow zone occupies the space between the half-tolerance mark and the specification limit. The red zone is anything outside specification.
Unlike an X-bar R or Individuals chart, Pre-Control does not calculate control limits from subgroup data. It uses the engineering specification directly. This is a fundamental difference: SPC asks whether the process is statistically stable; Pre-Control asks whether the process is producing conforming parts and whether it is drifting toward the edge.
| Zone | Range (mm) | Signal |
|---|---|---|
| Red | < 9.990 or > 10.010 | Stop immediately. Non-conforming. |
| Yellow | 9.990–9.995 or 10.005–10.010 | Caution. In spec but near the edge. |
| Green | 9.995–10.005 | Run. Safely centred. |
The Decision Rules
Pre-Control uses five rules. They can be taught in under 15 minutes and require no reference material on the floor.
Pre-Control Decision Logic
- 01Green sampleContinue running. Process is centred.
- 02Single yellowMeasure the next part. If green, resume. If yellow on the same side, stop and adjust.
- 03Two yellows, opposite sidesStop. Process variability is excessive — investigate before resuming.
- 04Red sampleStop immediately. Quarantine production since the last conforming measurement.
- 05Post-adjustment restartMeasure consecutive parts until five consecutive greens confirm the correction.
The Statistical Foundation
Pre-Control is often dismissed by statisticians as simplistic. The math says otherwise. If a process is centred with Cpk ≥ 1.33 — meaning the process spread consumes no more than three-quarters of the tolerance — the probability of a single part landing in the yellow zone is under 2%. The probability of two consecutive yellows on the same side is approximately 0.04%.
This means that two consecutive yellows are almost certainly not random variation. The process mean has shifted. Pre-Control triggers intervention at the exact moment the drift becomes detectable — before scrap is produced, not after. It is a predictive tool wearing the disguise of a stoplight.
When to Deploy Pre-Control vs Standard SPC
Pre-Control and classical SPC are not competitors. They serve different purposes, different users, and different time horizons.
Pre-Control vs SPC Application
Pre-Control
- Designed for operators in real-time production
- Requires Cpk ≥ 1.33 and a stable process
- Uses specification limits directly, no calculation
- Trains in 15 minutes; rules are deterministic
Classical SPC
- Designed for quality engineers analysing process behaviour
- Required for new, unstable, or poorly understood processes
- Demanded by IATF 16949 and AIAG SPC manual for PPAP
- Calculates Cpk/Cp and detects special-cause variation statistically
My recommendation is to run both. Pre-Control on the line, in the operator's hands, every shift. SPC in the background, reviewed by quality engineers on a weekly basis. Pre-Control is the first line of defence. SPC is the strategic layer.
What Happens When the Signal Is Ignored
Three months after I first saw those coloured wheels, the plant manager called me. A customer had raised a complaint about dimensional non-conformance on a critical bore diameter. Parts were at the edge of specification.
My first question was what the Pre-Control chart showed. The answer told the whole story. On Tuesday at 10:15, an operator had logged two consecutive yellows on the upper side — a classic mean-shift signal. She stopped the line and called maintenance per Rule 2. Maintenance checked the machine, found nothing obvious, and instructed her to resume running.
Pre-Control did exactly what it was designed to do. The failure was organisational: the system generated the correct signal and the hierarchy overrode it.
When I reviewed the measurement data, the shift was unmistakable. It had begun Tuesday morning. If the line had stayed down for a setup adjustment at 10:15, the plant would have avoided roughly 200,000 euros in sorting, containment, and customer-chargeback costs that hit two weeks later.
From that day forward, Rule 2 became inviolable at that plant. Two yellows means stop. No overrides, no waiting a few more parts. The operator was recognised in front of the full team — not for catching a defect, but for following a system that the organisation had initially failed to respect.
Implementation Sequence
Deploying Pre-Control is straightforward, but skipping steps guarantees failure. I have implemented this sequence across automotive and aerospace lines with consistent results.
- Select critical characteristics. Start with CC/SC parameters from your PFMEA — dimensions critical to function or flagged by the customer. Not every dimension needs Pre-Control.
- Define the zones. Map half-tolerance boundaries on the gauge itself — coloured tape, digital displays, or physical limit markers. The operator must see the zone without calculating.
- Set the sampling plan. For a stable process, measure every 25–50 parts. After setup or adjustment, measure every part until five consecutive greens are recorded.
- Train the team in 15–20 minutes. Use simulated data. Have operators practice the decision rules until they are automatic.
- Verify process capability. Pre-Control assumes Cpk ≥ 1.33. If capability is lower, the chart will stop the line constantly — which is correct behaviour. Fix the process first.
- Establish the reaction plan. When the chart signals stop, the operator must know exactly who to call, how long they have to respond, what happens to parts produced since the last green, and when restart is permitted.
Common Implementation Failures
Over years of implementing and auditing quality systems, I see the same four mistakes repeated. Each one undermines the tool and erodes operator trust in the system.
Overriding signals. An operator stops per the rules and is told to keep running. This is the single fastest way to destroy a Pre-Control system. If the rule says stop, the line stops. Maintenance responds to the operator, not the other way around.
Deploying on incapable processes. If Cpk is below 1.0, the chart will halt production every few minutes. This is not a tool failure — it is the process telling you it is not ready. Improve capability first, then implement Pre-Control.
Modifying the rules. Teams invent variations: two yellows but only if on the same side, or three yellows before stopping. The rules are simple because simplicity drives compliance. Every added condition reduces the probability that operators will follow them in real time.
Replacing SPC. Pre-Control does not replace control charts when a customer requires them under IATF 16949 or the AIAG SPC manual. Run Pre-Control as the operational layer. Maintain SPC for capability analysis, PPAP submission, and engineering review.
Pre-Control in Connected Manufacturing
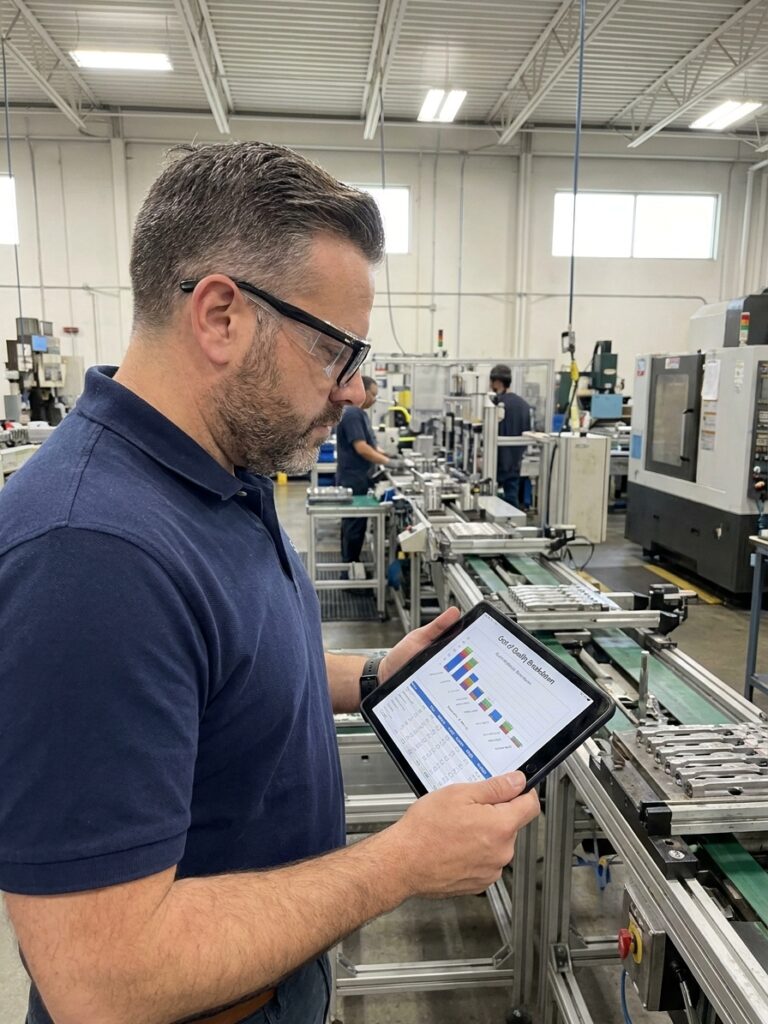
The principle does not change when the data path is digital. IoT gauges, automated classification software, and MES-integrated line-stop logic all execute the same five rules. What changes is the elimination of human discretion — the signal cannot be verbally overridden by a supervisor who wants to hit a takt target.
Digital Pre-Control also closes the feedback loop. Every measurement is logged. Trends that would be invisible on a paper chart become searchable. And when a stop event occurs, the system records the timestamp, the last conforming part, and the response time automatically.
The best quality system is the one the people on the line understand and trust. Pre-Control gives operators a tool that requires no statistical background, produces no ambiguous signals, and triggers action before defects are generated. In plants where I have implemented it alongside SPC, escape rates on monitored characteristics drop sharply — not because the math improved, but because the response time did.