Quality Andon Systems: When Your Shop Floor Learns to Scream for Help — and Your Whole Organization Starts Listening Before It’s Too Late

Uncategorized

Quality
Andon Systems: When Your Shop Floor Learns to Scream for Help — and Your
Whole Organization Starts Listening Before It’s Too Late

The Factory That Suffered
in Silence

Picture this: a Tier 1 automotive supplier in Bavaria, producing
precision-machined transmission housings for three major OEMs. Three
hundred operators working across two shifts. A quality department with
twelve inspectors and enough measurement equipment to fill a small
laboratory. ISO 9001, IATF 16949, every certification on the wall.

And yet, every Monday morning, the quality manager would find the
same thing in her inbox: a batch of customer complaints about parts that
should have never shipped. Not catastrophic failures — just enough
dimensional drift to cause assembly-line headaches downstream. The kind
of problems that don’t trigger a recall but erode trust one delivery at
a time.

When she walked the floor and asked operators why they hadn’t stopped
the line, the answer was always the same: “I thought the next
station would catch it.”
Or worse: “I wasn’t sure if it was
really a problem.”
Or the quietest, most dangerous version: “I
didn’t want to be the one who shut everything down.”

That factory had everything — trained people, good equipment,
documented procedures. What it didn’t have was a voice. Problems
happened, but they suffered in silence. The shop floor was like a
patient who keeps saying “I’m fine” while their vital signs tell a
completely different story.

And then they installed an Andon system. Not just the hardware —
lights, buttons, screens — but the entire cultural operating system that
makes those lights mean something. Within six months, line stops
increased by 400%. Customer complaints dropped by 73%.

More stops. Fewer complaints. That’s not a paradox. That’s the Andon
paradox, and understanding it will change the way you think about
quality forever.


What Is an Andon System —
Really?

The word “Andon” (行灯) comes from Japanese manufacturing
terminology. Originally, it referred to a paper lantern — a light that
illuminated the darkness. In the Toyota Production System, it became
something far more powerful: a mechanism that makes problems visible in
real time and gives every single person on the shop floor the authority
to stop production when they see something wrong.

But here’s what most people get wrong: an Andon system is not a stack
light on a machine. It’s not a red button that triggers an alarm. It’s
not a digital display board showing production counts.

An Andon system is a social contract encoded in
technology.

The hardware is simple: – A signal mechanism — a
button, a cord, a touch screen, or even a voice-activated trigger that
any operator can use – A visual indicator — lights
(typically green, yellow, red), display boards, or digital dashboards
visible to everyone in the area – An audio alert — a
tone, a melody, or a voice announcement that cuts through the ambient
noise of the factory – A response protocol — a defined,
trained, practiced routine for what happens when the signal is
activated

The magic isn’t in any of these components. The magic is in what they
represent: the unconditional right of any person to stop the
process when quality is at risk
. Not after checking with a
supervisor. Not after filling out a form. Now. Immediately. Without
consequences.

That last part — without consequences — is where most implementations
fail.


The
Three Levels of Andon: From Toy Lights to Transformational Tools

Level 1:
Informational Andon — “Something Needs Attention”

This is the most basic form. An operator notices a potential issue —
a slight vibration, a visual irregularity, a measurement trending toward
the control limit. They activate the Andon, typically triggering a
yellow light.

The line doesn’t stop. But a response person — usually a team leader
or a quality technician — is expected to arrive at the station within a
defined timeframe (typically 30 seconds to 2 minutes, depending on the
operation). They assess the situation together with the operator. If
it’s a false alarm, they reset and move on. If it’s real, they
escalate.

This level is about early detection. It catches
problems when they’re whispers, before they become shouts. It creates a
rhythm of rapid response that prevents small deviations from compounding
into large failures.

The key metric: response time. If the response person doesn’t arrive
within the target, the Andon automatically escalates to the next level.
The system doesn’t allow problems to wait.

Level 2:
Warning Andon — “We Have a Confirmed Problem”

When an issue is confirmed — a defective part, an out-of-spec
measurement, a process parameter outside the control limits — the Andon
shifts to a red signal. The line may slow down or stop, depending on the
severity and the station’s position in the process.

At this level, the response is structured. A quality technician takes
over the investigation. The defective parts are contained. The root
cause analysis begins using whatever tool is appropriate — 5-Why,
Ishikawa, quick-change analysis. The goal is not just to fix the
immediate issue but to understand whether this is a one-time event or a
symptom of something systemic.

This level is about containment and rapid diagnosis.
It prevents known defects from flowing downstream and ensures that the
corrective action addresses the real cause, not just the symptom.

The key metric: time to containment. How quickly are potentially
defective parts identified and quarantined? In world-class operations,
this is measured in minutes, not hours.

Level 3: Emergency
Andon — “Stop Everything”

This is the nuclear option, and it should be rare. When an operator
sees a safety hazard, a catastrophic quality failure, or any situation
where continuing production would cause irreparable harm, they hit the
full stop. Red lights flash across the entire area. The audio alarm is
unmistakable. Production halts.

At this level, the response involves the area manager, quality
engineering, maintenance, and potentially plant leadership. The
investigation is thorough. The restart criteria are strict — the problem
must be understood, contained, and a countermeasure verified before the
line can resume.

This level is about prevention of catastrophic loss.
It’s the ultimate expression of the quality-first principle: we would
rather stop and lose production time than ship a known defect or put
someone at risk.

The key metric: frequency of use relative to escape rate. If you’re
stopping the line frequently but still having escapes, your response is
ineffective. If you’re never stopping the line but your customer
complaints are rising, your culture is suppressing signals.


The Anatomy
of a World-Class Andon Implementation

Physical Design: Seeing Is
Believing

The visual design of an Andon system matters more than most engineers
think. It’s not just about brightness — it’s about information
density at a glance
.

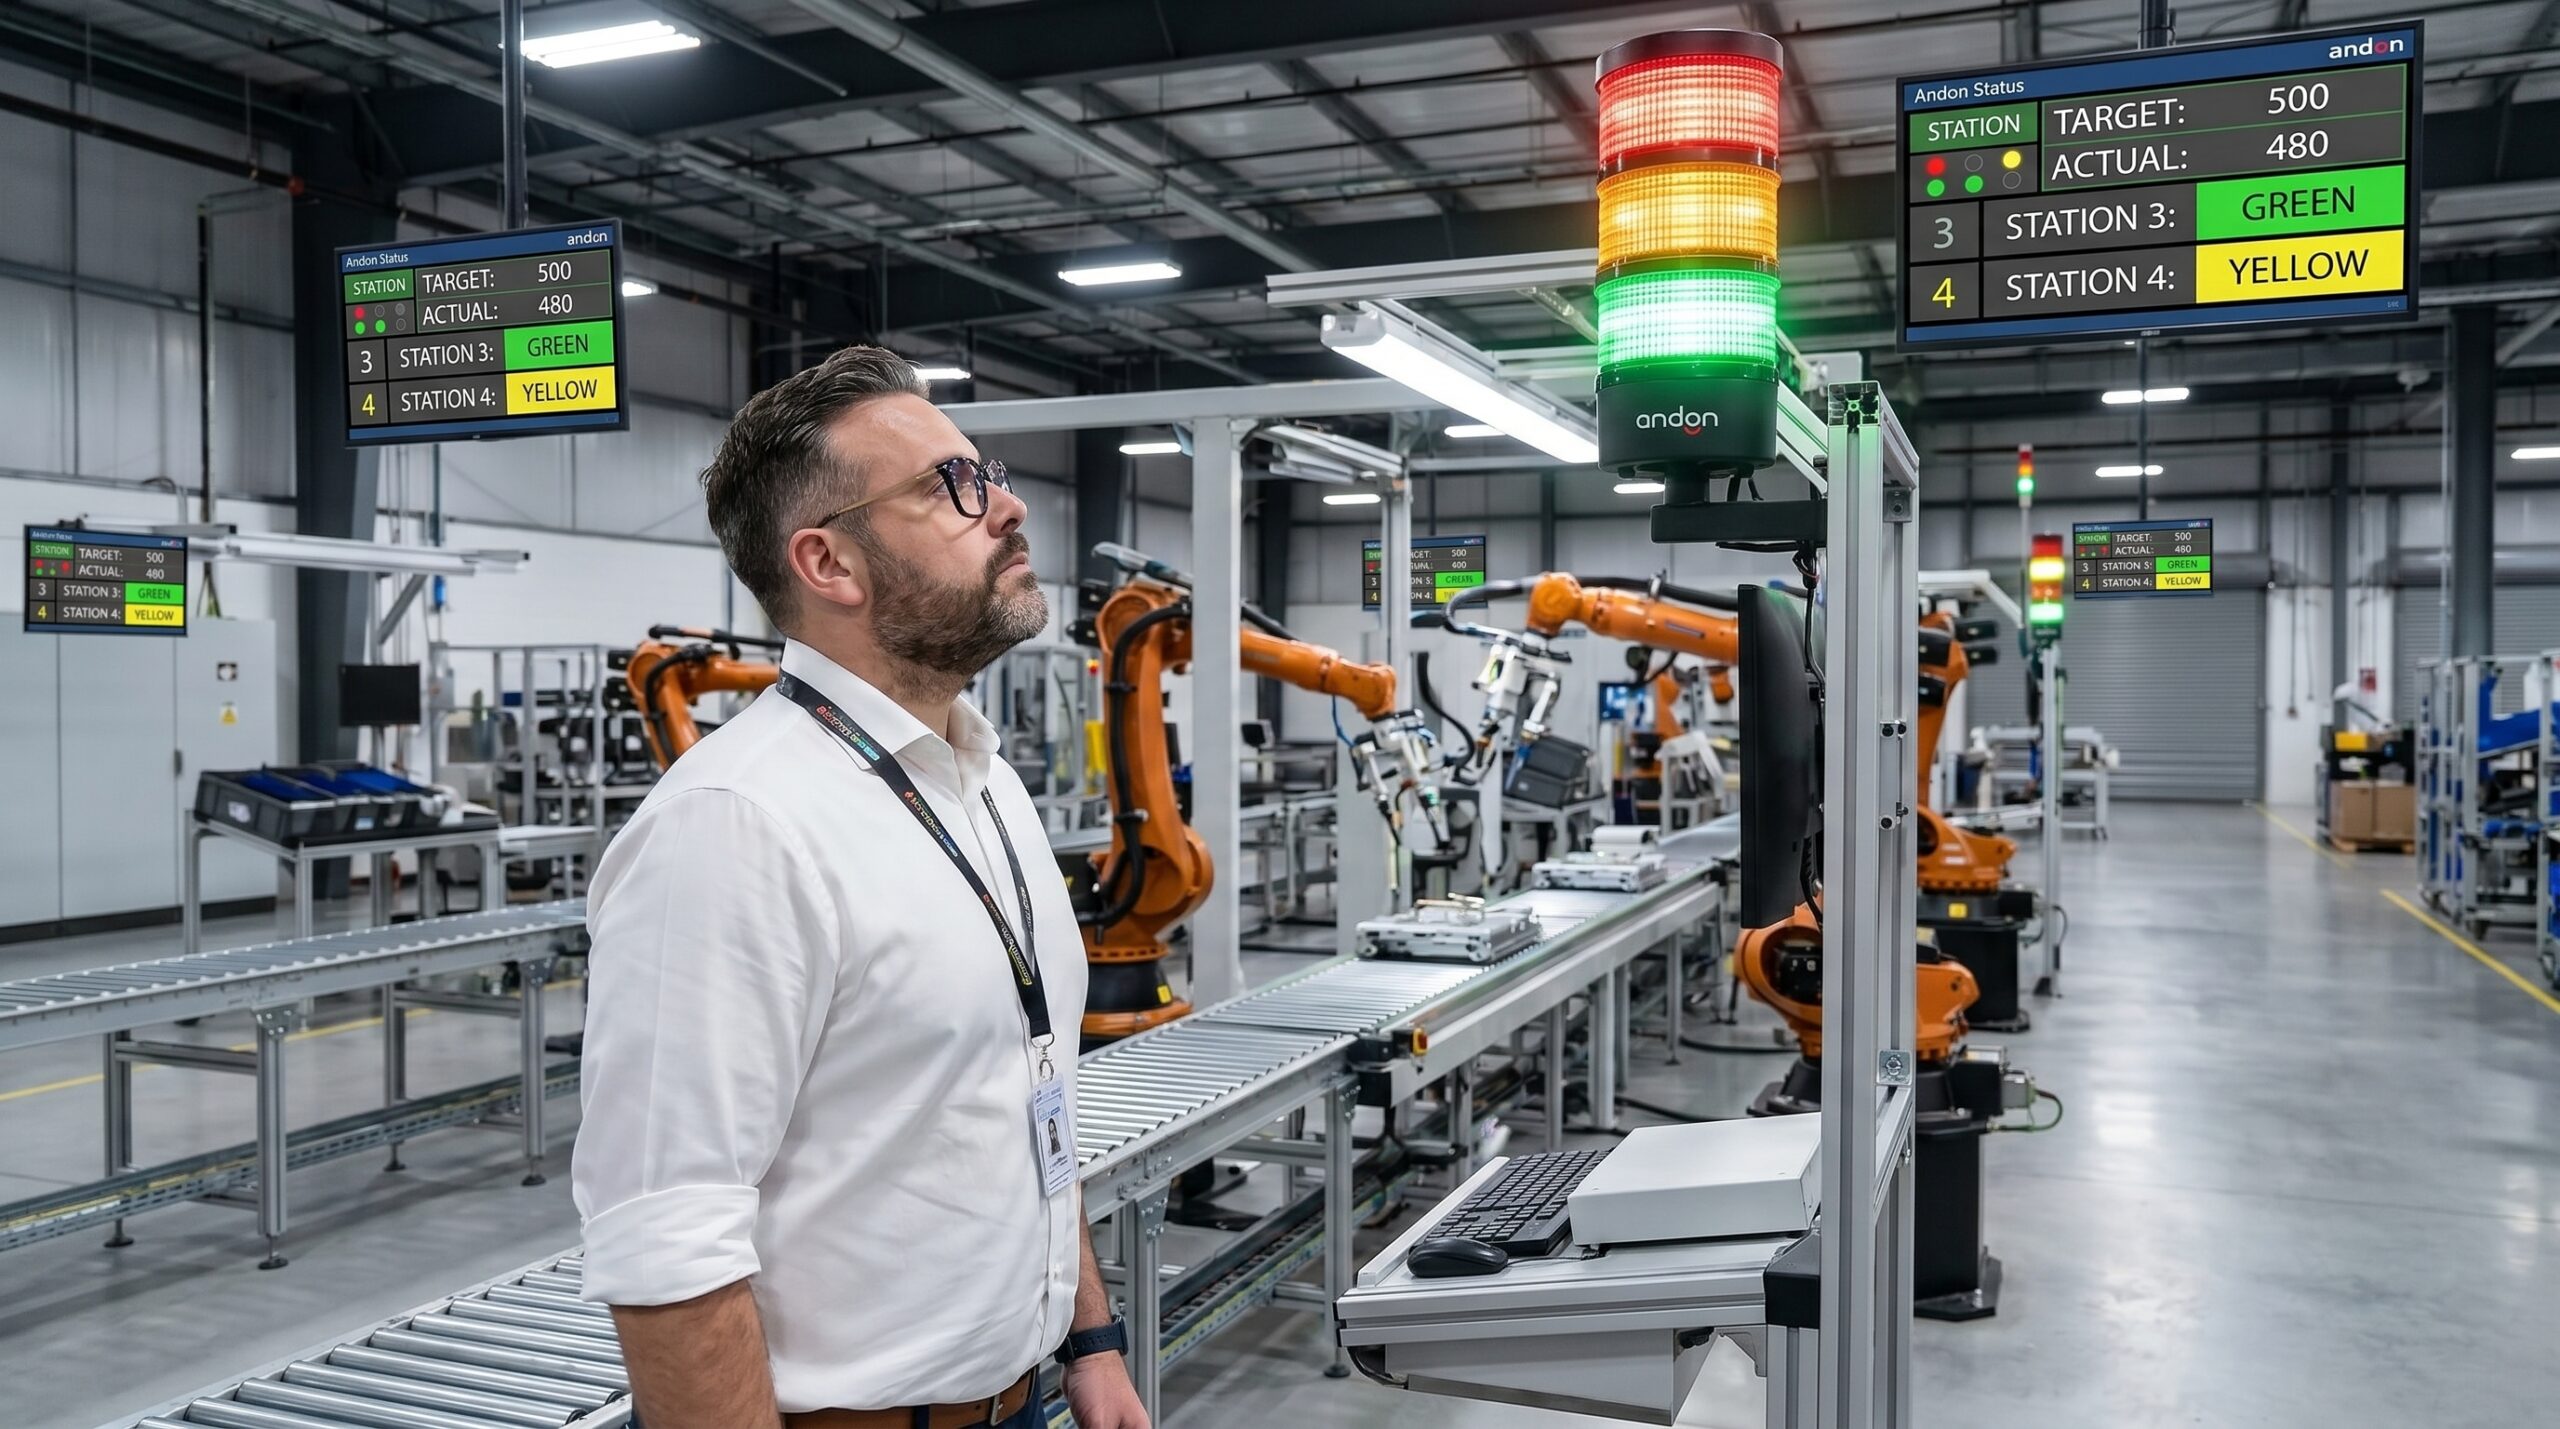
A well-designed Andon board shows, at minimum: – Station
status
(green = normal, yellow = attention needed, red =
stopped) – Reason code (a standardized set of
categories: quality, material, machine, method, safety) –
Duration (how long the current status has been active)
Response status (has a responder acknowledged? Are
they en route?)

In modern implementations, large LED displays or digital dashboards
replace the traditional light stacks. These can show richer information
— trend data, historical patterns, even live SPC charts alongside the
Andon status. But the fundamental principle remains the same: anyone
walking through the area should be able to assess the health of the
operation in under five seconds.

If your Andon board requires explanation, it’s not working.

Response Protocol: The
Rhythm of Rescue

The Andon signal without a response protocol is just expensive
decoration. The protocol defines who responds, how quickly, what they do
when they arrive, and what happens if they don’t come.

Toyota’s original standard: a team leader responds within 30
seconds
. Not “as soon as possible.” Not “when they’re free.”
Thirty seconds. Measured, tracked, and managed.

The protocol typically follows this sequence: 1. Signal
activated
— Operator triggers the Andon 2.
Acknowledgment — Visual/audio confirmation that the
signal was received 3. Response dispatch — The
designated responder moves to the station 4. Arrival
confirmation
— The responder logs their presence (often by
pressing a button at the station) 5. Assessment
Responder and operator evaluate the situation together 6.
Decision — Continue, contain, or stop. The call is made
based on defined criteria, not gut feeling 7. Action
Countermeasure is applied, parts are contained, documentation is
completed 8. Reset — The Andon is cleared, and the
station returns to normal

Each of these steps is timed. Each is tracked. Patterns in the data
reveal systemic issues — a station that triggers the Andon ten times per
shift has a different problem than the responder who takes eight minutes
to arrive.

Cultural Foundation:
The Permission to Stop

Here’s the uncomfortable truth: most organizations say they want an
Andon system, but they don’t want what comes with it. They want the
lights, the boards, the technology. They don’t want the line stops, the
production losses, the very visible evidence that their processes are
imperfect.

An Andon system without psychological safety is a surveillance tool.
Operators will quickly learn that pulling the cord brings scrutiny,
questions, and implied blame. They’ll stop pulling it. The lights will
stay green. The dashboard will show 100% uptime. And the defects will
keep flowing.

Building this culture requires three non-negotiable elements:

1. Leadership modeling. Plant managers and area
supervisors must actively encourage Andon use. Not passively tolerate it
— actively celebrate it. When an operator stops the line for a quality
concern, the first words out of the supervisor’s mouth should be “Thank
you.” Not “Why did you stop?” but “What did you see?”

2. No blame, no shame. The Andon system tracks
problems, not people. Data from Andon activations is used to improve
processes, not to evaluate individual operators. If an operator triggers
a false alarm, they’re coached — positively. The message is: “We’d
rather have ten false alarms than one escaped defect.”

3. Follow-through. Every Andon activation that
identifies a real problem must result in visible corrective action. If
operators see that their signals disappear into a black hole of
bureaucratic inaction, they’ll stop signaling. The system requires
closure — not just on the immediate fix, but on the root cause.


The
Digital Andon: Where Industry 4.0 Meets the Shop Floor

Modern Andon systems are evolving beyond lights and buttons. IoT
sensors, machine learning, and cloud connectivity are adding
capabilities that Toyota’s original designers could never have
imagined.

Predictive Andon: Instead of waiting for an operator
to notice a problem, sensors monitor process parameters in real time —
vibration, temperature, force, cycle time deviations. Machine learning
algorithms detect patterns that precede defects and trigger the Andon
before the defect actually occurs. The system shifts from reactive to
predictive, stopping problems before they exist.

Connected Andon: When an Andon is triggered, the
signal doesn’t just light up a local board. It sends real-time
notifications to quality engineers’ phones, updates the production
monitoring system, logs the event in the quality management software,
and — in advanced implementations — automatically adjusts upstream
processes to prevent cascading effects. The Andon becomes a node in a
connected quality ecosystem.

Data-Driven Andon Analytics: Every Andon activation
generates data — when, where, why, how long it took to respond, what the
outcome was. Aggregated over weeks and months, this data reveals
patterns that no individual observation could. Stations with chronic
issues. Shifts with slower response times. Problem categories that
cluster around specific materials or changeover events. The Andon system
becomes a diagnostic tool for the entire operation.

Augmented Reality Andon: Some advanced
implementations use AR glasses or heads-up displays to provide
responders with real-time information when they arrive at a station —
the last ten Andon events at that location, the relevant control plan,
the standard response procedure. The responder doesn’t need to go back
to a desk to look up information; it’s in their field of vision as they
assess the problem.

But here’s the critical caveat: technology amplifies culture. A
digital Andon system in a blame-oriented culture will just produce more
sophisticated suppression. The sensors will be “calibrated” to reduce
false alarms. The analytics will be used to identify “problem
operators.” The AR glasses will display the wrong information because
the data was never entered honestly.

The technology is an accelerator, not a substitute. Get the culture
right first. Then the technology makes it fly.


Implementation: A Practical
Roadmap

Phase 1: Foundation (Weeks
1-4)

Start with a single line or area — ideally one with known quality
issues and a receptive team leader. Define the reason codes (keep it to
5-7 categories). Install the physical Andon — lights, buttons, a simple
display board. Train the operators and the response team.

Don’t worry about data analytics or digital integration yet. Focus on
the rhythm: signal, respond, assess, act, reset. Practice it until it’s
muscle memory.

Critical success factor: The team leader must
respond within the target time on every single activation. If they
can’t, you need more coverage or a simpler process. Slow response kills
Andon culture faster than anything else.

Phase 2: Expansion (Weeks
5-12)

Roll out to additional lines. Start tracking the data — activation
frequency, response time, resolution time, reason code distribution. Use
the data to identify systemic issues and prioritize improvements.

Introduce the concept of Andon-based problem solving — using Andon
data as input to Kaizen events, FMEA updates, and control plan
revisions. The Andon system should feed the improvement system, not
exist alongside it.

Begin measuring the “Andon paradox metrics”: Are line stops
increasing while escapes are decreasing? That’s the signature of a
healthy Andon culture.

Phase 3: Maturation (Months
4-12)

Integrate with the broader quality system. Connect Andon data to your
QMS. Feed it into management reviews. Use it to drive supplier
development (if a significant percentage of Andon activations are
material-related, that’s a supplier quality issue, not a shop floor
issue).

Implement the analytics. Look for patterns over time. Benchmark
against industry standards (world-class operations typically see Andon
activation rates of 5-15% of cycles, with response times under 60
seconds).

Begin the shift from reactive to predictive. Where can sensors
replace human detection? Where can machine learning identify patterns
before they become problems?


The Metrics That Matter

An Andon system generates a wealth of data, but only a few metrics
truly indicate system health:

Metric What It Tells You World-Class Target
Activation Rate Are people using the system? 5-15% of cycles
Response Time Is the protocol working? < 60 seconds
False Alarm Rate Is operator training adequate? < 20% of activations
Escape Rate Is containment effective? < 0.1%
Recurrence Rate Are root causes being addressed? < 5% of problems recur

The relationship between these metrics tells the real story. A high
activation rate with a low escape rate and a decreasing recurrence rate
is the gold standard — people are signaling, problems are being caught,
and solutions are sticking.

A low activation rate with a rising escape rate is the warning sign —
your culture is suppressing signals, and defects are leaking
through.

A high activation rate with a high recurrence rate means you’re
detecting problems but not solving them — your corrective action process
is broken.


Common Failure Modes
— and How to Avoid Them

Failure Mode 1: The Decoration Syndrome. The lights
are installed, the buttons are there, but nobody uses them. The system
becomes background noise — part of the factory landscape that everyone
ignores.

Cause: Lack of response protocol or leadership indifference.
Fix: Make Andon response a primary job responsibility for team
leaders. Track and review response metrics daily.

Failure Mode 2: The Punishment Loop. Operators use
the system, and the consequences are negative — questions, blame,
pressure to “not make such a big deal about it.”

Cause: Blame culture, or production targets that override
quality. Fix: Remove individual attribution from Andon data.
Shift supervisor mindset from “why did you stop?” to “what did you
see?”

Failure Mode 3: The Black Hole. Operators activate
the Andon, responders arrive, problems are identified — but nothing
changes. The same problems trigger the same Andon activations week after
week.

Cause: Disconnect between Andon data and the corrective
action system. Fix: Close the loop. Every recurring Andon
activation should trigger an escalation in the improvement system — from
a quick fix to a Kaizen event to a capital project, as the data
demands.

Failure Mode 4: The Overengineered Monster. The
Andon system becomes so complex — with digital dashboards, IoT
integration, AI analytics — that the fundamental simplicity is lost.
Operators aren’t sure how to use it. Responders are overwhelmed by data.
The system collapses under its own weight.

Cause: Technology-first implementation instead of
culture-first. Fix: Start simple. Lights, buttons, protocols.
Add technology only when the basic system is working and the culture is
strong enough to absorb it.


The Andon Mindset:
Beyond the Factory Floor

The principles of Andon — make problems visible, respond quickly,
solve them permanently, and never punish the messenger — extend far
beyond manufacturing. Software development teams use “build breakers”
that stop the deployment pipeline when tests fail. Healthcare
organizations implement “stop the line” protocols for patient safety.
Service companies use real-time dashboards that make quality issues
visible the moment they occur.

The common thread: problems that are invisible are problems
that persist
. An organization that can’t see its problems can’t
fix them. An Andon system — whether it’s a stack of lights on a factory
floor or an automated alert in a software pipeline — is a commitment to
seeing reality as it is, not as we wish it were.

That Bavarian transmission supplier? They eventually installed Andon
systems across all twelve production lines. The weekly quality review
changed from “what went wrong last week?” to “what did our Andon system
teach us last week?” The Monday morning inbox filled up with something
different: Andon data analysis, trend reports, and requests for
resources to address the patterns the system had revealed.

The factory didn’t stop having problems. But it stopped hiding them.
And in quality, visibility is the first and most powerful step toward
excellence.


Peter Stasko is a Quality Architect with over 25
years of hands-on experience in automotive and manufacturing quality
management. He specializes in building quality systems that work in the
real world — not just on paper. His approach combines deep technical
expertise with a relentless focus on the human side of quality: culture,
leadership, and the daily habits that separate world-class operations
from the rest.

Scroll top