
Statistical Process Control is the discipline of using data to keep a manufacturing process inside its specification limits. In both aerospace and automotive manufacturing, SPC is the mechanism that separates a process you can trust from one that requires constant firefighting. It shifts the quality function from defect detection to defect prevention.
During my time implementing quality systems at a major aerospace manufacturer, I saw firsthand how an uncontrolled line generates hidden costs through scrap, rework, and audit non-conformities. Applying SPC rigorously means you stop reacting to random noise. You start identifying the specific signals that indicate a real process shift, and you act on them before defective parts reach the customer.
The core requirement of standards like AS9100 and IATF 16949 is predictable, capable processes. SPC provides the mathematical proof of that capability. Without control charts tracking critical characteristics, a quality management system is built on assumptions. With them, it is built on evidence.
Special-Cause vs Common-Cause Variation
The fundamental error in manufacturing quality is treating every data point as an emergency. Operators adjust machine settings when they see a measurement drift, attempting to correct what is actually inherent, common-cause variation. This over-adjustment injects new instability into a process that was already behaving normally within its statistical boundaries.
Special-cause variation is different. It is a signal—a broken tool, a contaminated material batch, or a faulty sensor. SPC uses control limits, typically set at plus or minus three standard deviations from the process mean, to separate these signals from background noise. When a data point breaches a control limit, it demands an immediate, targeted response.
I have trained production teams to stop chasing random data fluctuations and wait for a genuine statistical signal. The cultural shift is immediate. Scrap drops because machines run undisturbed. When an alert finally triggers, the team investigates with purpose, files an 8D report, and finds the true root cause rather than guessing at it.
SPC Performance Thresholds
Process Capability: Stability Is Not Enough
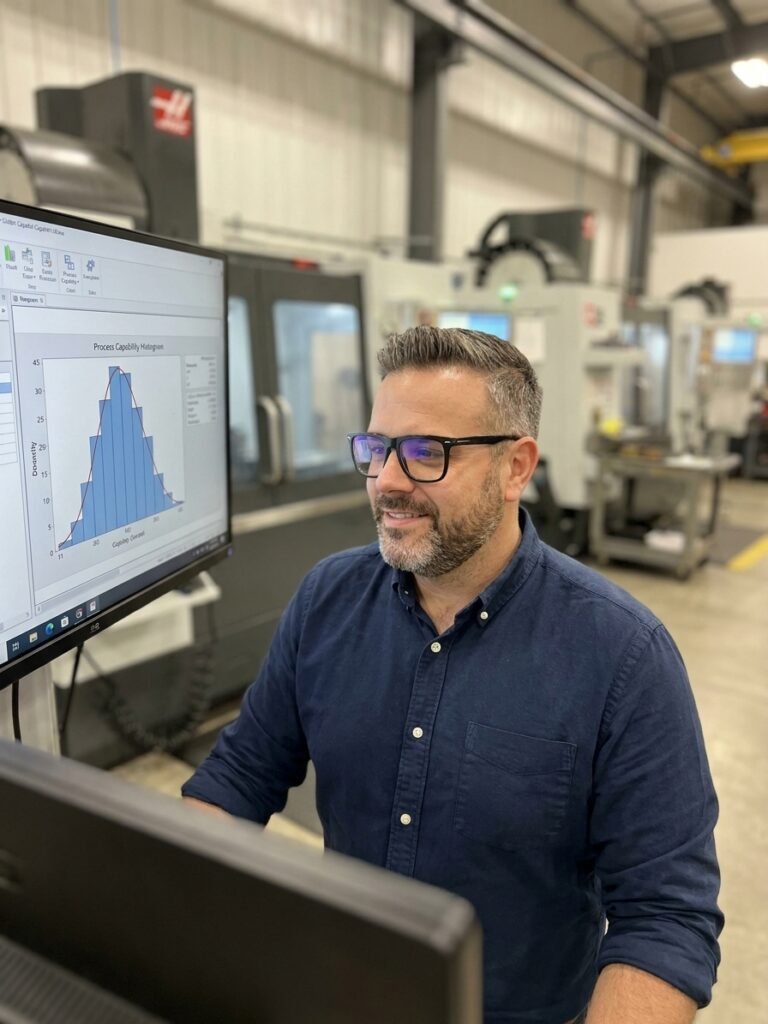
A stable process is not automatically a good process. You can have a manufacturing line that produces parts with absolute consistency—but if the output consistently falls outside engineering tolerances, you are simply manufacturing scrap at a highly predictable rate. Stability proves the process is in control; capability proves it is actually fit for purpose.
We measure this fitness using capability indices like Cp and Cpk. Cp measures the potential capability of your process spread compared to the tolerance width. Cpk factors in the process mean, telling you how centred that spread is within the specification limits. A process must be statistically stable before you can trust these calculations.
If your Cpk sits below 1.0, the process is fundamentally incapable. You cannot inspect your way out of this; you must change the process design, the tooling, or the material. When I build a Production Part Approval Process (PPAP) package, proving a capable Cpk through baseline SPC data is the non-negotiable prerequisite for moving into serial production.
Selecting the Right Control Charts
Implementing SPC on every single dimension on a drawing is a waste of engineering effort. You must identify the critical-to-quality (CTQ) characteristics first. These are the dimensions or parameters driven by PFMEA risk analysis—the ones with the highest severity or occurrence ratings that threaten safety, regulatory compliance, or core function.
For variable data—anything you can measure on a continuous scale like torque, thickness, or temperature—you typically deploy X-bar and R charts. X-bar tracks the process average over time, while the R chart tracks the range or spread within each subgroup. Together, they reveal whether your process mean is drifting or your process variation is expanding.
For attribute data—pass/fail results, visual defect counts—you use P-charts or C-charts. These track proportions or specific event occurrences. Attribute charts are less statistically powerful than variable charts, which is why you should always try to convert a visual inspection into a measurable variable wherever technically and economically feasible.
Implementing SPC in Aerospace Manufacturing
At a major aerospace manufacturer, operating under AS9100 requirements, the margin for process error is effectively zero. Aerospace safety demands strict adherence to specified tolerances. Implementing SPC on the shop floor meant giving operators the tools to see process drift in real-time, rather than waiting for a final quality inspection to catch a non-conforming assembly.
I introduced Routing Verification KPIs supported by live SPC data at critical workstations. This initiative cut internal lead time by 97%. The control charts functioned as a real-time visual management tool. When a point drifted toward the upper control limit, the operator knew to call engineering before the part breached the specification.
A successful aerospace SPC implementation requires rigorous operator training. The team must understand the statistical rules—like the Western Electric rules for detecting trends and shifts—and know exactly what action to take when a chart signals an out-of-control condition. A control chart with no documented reaction plan is just decoration on a factory wall.
A control chart without a documented reaction plan is just decoration on a factory wall.
Building SPC Systems in Automotive Plants
Transitioning to automotive standards like IATF 16949 requires SPC to be integrated directly into the Advanced Product Quality Planning (APQP) phase. In the automotive sector, high-volume production means even minor process drift results in massive scrap piles. SPC is the early warning system that prevents minor deviations from becoming full-scale quality escapes.
When I built a greenfield QA/QC department for a 900-plus employee automotive plant, the priority was establishing baseline capability. We mapped every CTQ characteristic from the PFMEA, installed data collection terminals at the point of manufacture, and established control charts for critical dimensions. We linked these directly to our overall equipment effectiveness (OEE) tracking.
The discipline of SPC also streamlines supplier quality management. If a supplier submits PPAP documentation lacking capable SPC data, the submission should be rejected. Requiring a minimum Cpk of 1.67 for initial capability ensures that suppliers have proven their process before they ship a single production part to your assembly line.
SPC Implementation Sequence
- 01Identify CTQsPull high-risk characteristics from the PFMEA.
- 02Determine MSARun gauge R&R to ensure the measurement system is reliable.
- 03Establish Control ChartsDeploy X-bar and R charts for variable data on the floor.
- 04Calculate CapabilityVerify Cpk is greater than 1.33 before full production launch.
- 05Enforce Reaction PlanTrigger 8D investigation when control limits are breached.
Sustaining the System Through Audits
Statistical Process Control is not a project you finish; it is a system you sustain. During internal and external audits—whether for IATF 16949, VDA 6.3, or AS9100—auditors look for live, breathing SPC data. They want to see that you are actively using the charts to drive continuous improvement, not just filing them away for compliance purposes.
When a special-cause signal appears on a control chart, the subsequent 8D problem-solving report is your proof that the system works. The 8D documentation captures the root cause analysis, the containment actions, and the permanent corrective actions. This closed-loop process demonstrates that your quality system is actively learning and preventing future failures.
Sustainability requires periodic review of the control limits themselves. If you improve a process through targeted engineering changes, the old control limits become obsolete. Recalculating your limits to reflect the new, tighter process baseline ensures your SPC system remains sensitive to future drift and drives the next cycle of waste reduction.