
Every product follows the same reliability trajectory. Failure rates are high at launch, drop sharply during normal operation, and climb again as components approach their design limits. This bathtub curve is not academic theory; it is the mathematical reality of manufacturing across automotive, aerospace, and electronics.
The danger lies in how most quality systems react to this reality. They aggregate failure data, calculate an average defect rate, and apply identical corrective action tools regardless of where the product sits on the timeline. A wear-out failure receives the same 8D investigation as an assembly defect.
This aggregated approach destroys signal. Each phase of the curve has entirely different physical failure mechanisms, requiring fundamentally distinct quality strategies. You cannot solve an infant mortality problem with predictive maintenance, and you cannot prevent wear-out with tighter in-process inspection.
Infant Mortality: Trapping Defects Before They Ship
The left side of the bathtub curve is driven by manufacturing escapes. Latent defects, assembly errors, and marginal components reveal themselves within hours or days of first use. In IATF 16949 environments, these failures generate warranty claims during the first twelve months of service.
These defects are not random. They pass through your facility because your process allowed the nonconformance, and your final quality inspection lacked the resolution to catch it. A standard end-of-line roll test will not detect a bearing with a compromised race that will fail at five thousand kilometers.
To flatten the left side of the curve, you must accelerate stress. Burn-in testing subjects products to elevated thermal and electrical loads, forcing weak units to fail inside the factory where the cost is measured in scrap rather than field returns. Highly Accelerated Life Testing pushes prototypes beyond specification limits during development to identify breaking points before production tooling is ever cut.
Useful Life: Monitoring the Constant Failure Rate
The bottom of the bathtub curve represents useful life. Failure rates here are low, stable, and genuinely random. These failures stem from unexpected stress events or statistical anomalies in component quality, not from systematic process breakdowns.
This phase is where quality teams become complacent. Warranty claims taper off, customer complaints drop, and Cpk data looks stable. The natural impulse is to shift resources elsewhere, assuming the product is inherently robust.
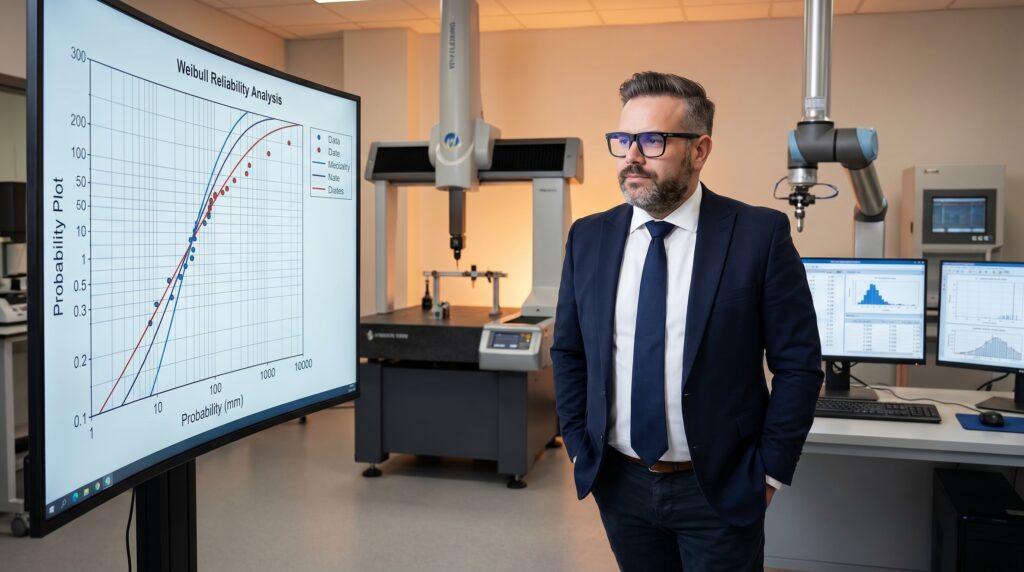
Applying root cause analysis to these random events is a trap. Launching an 8D investigation every time a unit fails during useful life wastes engineering resources chasing anomalies that lack a single, identifiable cause. The correct strategy is rigorous monitoring for deviations from the expected baseline.
Weibull Shape Parameter Thresholds
Wear-Out: Engineering Predictable Endpoints
The right side of the curve rises as materials degrade, seals harden, and coatings corrode. Wear-out is not a defect; it is the culmination of a product reaching its intended design life. It is the most predictable failure mode in engineering.
Organizations fail at wear-out because their tracking horizons are too short. A standard quality system monitors a product through its one-to-three-year warranty period. When field failures spike at seven years, the engineering team has moved on, the manufacturing lines are scrapped, and the data goes to a department lacking the budget to act.
Accelerated Life Testing bridges this gap. By running development units through intensified stress cycles, engineers map the exact timeline of degradation. This data feeds preventative maintenance schedules for serviceable products, ensuring components are replaced just before their predictable failure window begins.
Applying SPC to wear-out failures detects a trend that is already a known engineering certainty, not a process shift.
Why Aggregated Data Obscures Root Causes
Most organizations dump every field return into a single database and calculate an overall defect rate. This aggregation destroys actionable intelligence. Averaging infant mortality, useful life, and wear-out failures together tells you nothing about how to fix your process.
This aggregated mindset leads to severe tool misapplication. Teams apply Statistical Process Control to wear-out data, expecting to catch a process shift when the trend is actually mechanical degradation. They run root cause investigations on useful life failures, searching for a systematic cause where none exists.
The solution is segmenting field failure data by time-in-service. Breaking warranty returns into distinct buckets, from zero to three months up to five-plus years, exposes the true shape of your product's curve. You cannot allocate quality resources effectively until you see which phase drives your highest costs.
| Curve Phase | Primary Mechanism | Required Quality Tool |
|---|---|---|
| Infant Mortality | Manufacturing escapes | PFMEA and Burn-in Screening |
| Useful Life | Random stress anomalies | Weibull Analysis and SPC |
| Wear-Out | Material degradation | Accelerated Life Testing |
Aligning the Quality System with the Curve
Building a bathtub-aware system means assigning the right inspection and testing resources to each phase. During product launch, your focus must be aggressive containment. Design for Manufacturing reviews and First Article Inspection protocols must validate process capability to prevent marginal units from escaping.
I have audited plants that proudly show stable Cpk data while their warranty claims spiral out of control. The disconnect happens when the factory floor metrics measure dimensional conformance, but the field failures stem from wear-out mechanisms the inspection plan was never designed to catch.
Reliability engineering must hold a core voice in design reviews, not act as a compliance checkbox. The bathtub curve is permanently shaped during the design phase. By the time production begins, you are merely living with the mechanical limitations you engineered into the product.
Implementing a Segmented Reliability Strategy
- 01Segment Field DataBucket all warranty returns and field failures strictly by time-in-service.
- 02Calculate BetaRun a Weibull analysis on the top failure modes to classify the phase.
- 03Match the ToolApply PFMEA to early failures, SPC to mid-life, and ALT to end-of-life.
- 04Validate ScreeningCompare factory burn-in failure rates directly to early field returns.
Transition Failures and Brand Risk
The most destructive failures occur at the transitions between phases. These are the infant mortality defects that escape into the field, or the wear-out failures that begin unexpectedly early because a supplier quietly downgraded a material specification to save cost.
Transition failures trigger recalls and generate class-action exposure because they shatter the customer's expectation of predictable performance. They look like random events to a quality team that lacks segmented data, masking the true systematic cause until the financial damage is irreversible.
Understanding the bathtub curve is a technical capability, but acting on it requires cultural discipline. In a reactive culture, the curve is ignored and early failures are blamed on the customer. In a proactive culture, the curve drives every design review, process audit, and material change notification across the supply chain.