
Most engineers look at a control chart and check one thing: did any point cross the control limits? If the answer is no, they move on. This is the equivalent of only hearing the word 'help' and ignoring the tone of voice.
Processes communicate far more subtly through systematic, non-random arrangements of points. These control chart patterns indicate the presence of an assignable cause — a specific, identifiable change in the process that you must find and eliminate.
The AIAG SPC Manual defines eight classic non-random patterns. Recognising them shifts your quality strategy from reactive containment to predictive prevention.
The Gear Plant: A Predictable Failure
I once worked with a transmission manufacturer facing unpredictable dimensional deviations on gears. It happened perhaps once every six weeks. The overall average was fine, the Cpk index looked solid at over 1.33, yet occasionally a batch failed final inspection.
The classical response is to increase inspection frequency or add layout inspectors. We did neither. We pulled the X-bar charts and looked at the data's behaviour.
We found that roughly three weeks before every dimensional breach, a subtle trend emerged: four to five consecutive points steadily drifting upward. It never triggered the standard Western Electric rules, but the pattern was consistent. The trend mapped perfectly to the gradual wear of a CNC fixture. When clamping force dropped below a critical threshold, the part shifted during machining.
We implemented a preventive fixture replacement every three weeks. The cost was negligible. The scrap and nonconformance costs we eliminated amounted to tens of thousands of euros annually.
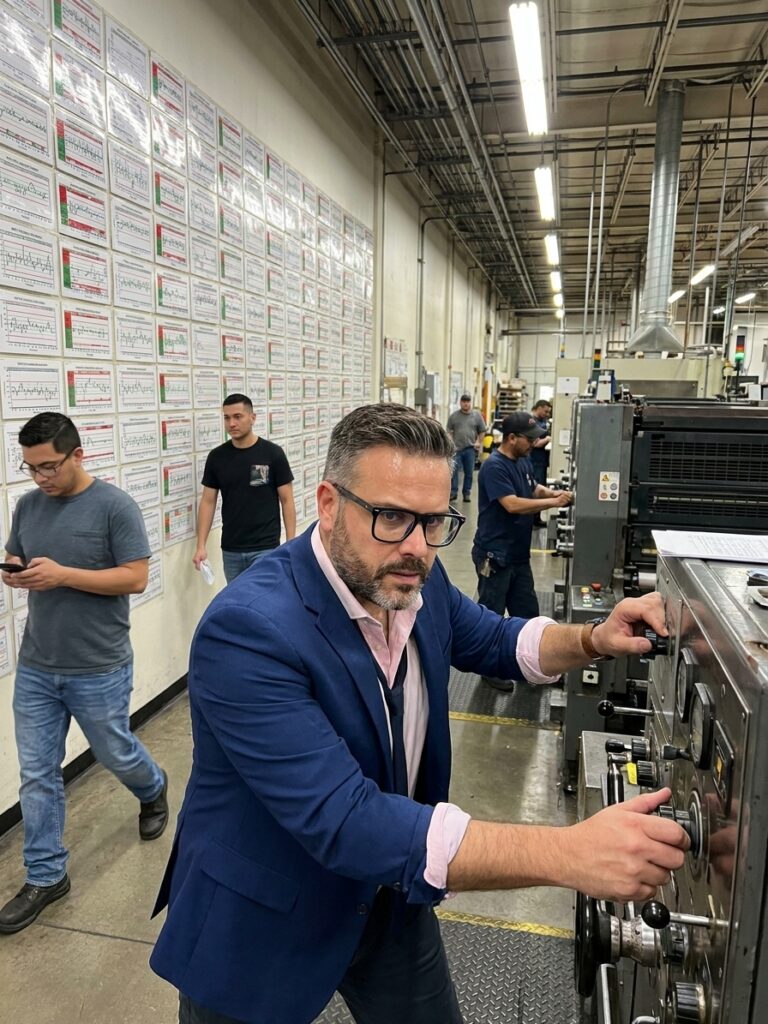
The Eight Non-Random Patterns
These patterns are defined for variables charts (X-bar, R, S, I-MR). Each pattern tells a specific story about process mechanics.
1. Point Beyond Limits (UCL/LCL)
A single point breaches the upper or lower control limit. This is a screaming siren indicating an immediate, explosive event.
Causes: Sudden material change, tool fracture, power surge, or measurement system failure. Action: Stop the line, contain the product, and run an 8D investigation.
2. Zone C Test (Run of 9)
Nine consecutive points on the same side of the centre line. The process has shifted systematically, not explosively.
Causes: A new batch of material with slightly different properties, a machine setup change, progressive tool wear, or a new operator technique.
3. Trend (Six Points Ascending or Descending)
Six consecutive points steadily increasing or decreasing. The process is not in equilibrium; a factor is changing gradually over time.
Causes: Tool wear, filter clogging, or temperature drift. This pattern provides early warning. If you wait for a limit breach, you have already produced nonconforming parts.
4. Stratification (Run of 15 in Zone C)
Fifteen consecutive points within 1-sigma of the centre line. It looks perfectly stable to the untrained eye, but it is a red flag.
Causes: Incorrectly calculated control limits (too wide), data filtering, or stratification. This often happens when three shifts measure the same process but average the data together. The distinct distributions average out into a falsely narrow band. Solution: Stratify the data by shift and analyse it separately.
5. Over-Adjustment (14 Points Alternating)
Fourteen consecutive points alternating up and down. This regular zigzag indicates operator manipulation. An operator sees a reading above centre, adjusts the machine down, and the next reading falls below centre.
Tampering with a process that is in statistical control only increases variability.
Action: Stop adjusting the process based on single readings. Follow Deming's rule: do not adjust a stable process.
| Pattern | AIAG Rule | What It Indicates |
|---|---|---|
| 2 of 3 in Zone A | 2 of 3 points beyond 2σ | A moderate process shift beginning |
| 4 of 5 in Zone B | 4 of 5 points beyond 1σ | A smaller but consistent process shift |
| 8 Beyond Zone C | 8 consecutive points beyond 1σ | Bimodal distribution or reduced variability |
Implementing Pattern Recognition on the Shop Floor
Knowing the theory does not change the factory floor. Implementing systematic pattern recognition requires a structured deployment of SPC rules, operator training, and clear reaction plans.
Deploying SPC Pattern Detection
- 01Select Chart TypeUse X-bar/R, X-bar/S, or I-MR charts for variables data.
- 02Define Critical RulesStart with three rules: Point Beyond Limits, Trend (6), and Zone C (Run of 9).
- 03Train OperatorsHang visual guides at SPC stations with real examples from your process.
- 04Establish Reaction PlansDefine exactly who to call, what to stop, and what data to record.
- 05Automate DetectionUse Minitab, InfinityQS, or SAP QM to trigger alarms for subtle trends.
The Reaction Plan: Closing the Loop
When an operator identifies a valid pattern, they must know exactly what to do. A reaction plan defines the steps for each type of signal. Without it, operators will either ignore the signal or shut down the line unnecessarily.
- Who to inform (supervisor, quality engineer, maintenance).
- Immediate containment (stop the machine, quarantine the last 5 parts).
- Data to record (time, shift, material lot, machine setup parameters).
- Conditions for resuming production (after verification, correction, or revalidation).
Common Interpretation Failures
Over 20 years of auditing and implementing IATF 16949 and AS9100 systems, I see the same mistakes repeated across plants.
Reacting to every fluctuation: Not every point outside the expected range is a signal. Common cause variation exists. The AIAG rules are designed to minimise false alarms — use them instead of operator intuition.
Ignoring trends because limits are not breached: This is the most dangerous error. A trend can last weeks before crossing a limit. By then, you have shipped defective product.
Failing to recalculate limits: If you improve a process and reduce its variability (e.g., achieving Cpk 2.0), you must recalculate the control limits. Old limits on a new process will hide genuine patterns or generate false signals.
Cultural Resistance to Early Signals
In many organisations, the barrier is cultural, not technical. An operator sees a trend developing but fails to report it because it hasn't breached a limit. A supervisor ignores the Zone C rule because there is a production order to fulfil.
This behaviour destroys SPC effectiveness. Leadership must celebrate the identification of a pattern not as a problem, but as a successful early warning. Never punish a false alarm. It is better to investigate ten harmless signals than to miss one genuine shift that costs a customer.