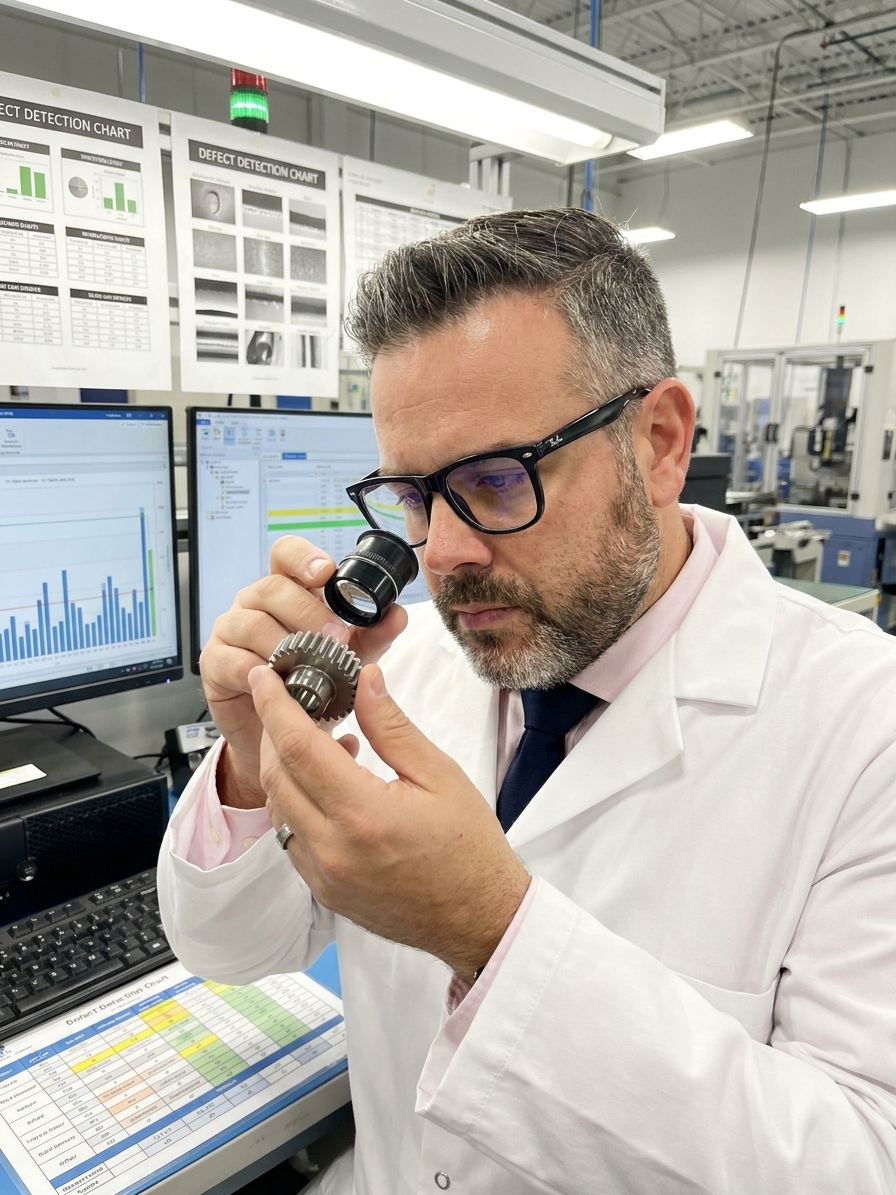
When an organisation discovers a new defect type, reported incidence of that defect skyrockets. Inspectors who never saw the problem suddenly cannot stop finding it. Engineers who dismissed the failure mode become obsessed with it. The defect was always present in the process. What changed was the perceptual filter of the people looking at it.
This is the frequency illusion—commonly known as the Baader-Meinhof Phenomenon. Once the human brain registers a pattern, it starts detecting that pattern with remarkable consistency. The signal was always in the noise; people simply started listening for it. In manufacturing environments, this cognitive bias carries severe operational consequences.
I have audited plants where a single customer rejection triggered weeks of hyper-vigilant inspection that inflated quality costs without improving the product. The phenomenon is not a curiosity. It is a structural risk to any IATF 16949 or AS9100 quality management system, and it corrupts the data your Pareto charts rely on.
How Selective Attention Distorts Defect Data
When an organisation starts looking for a specific defect, the reported incidence will increase. This is axiomatic. You find more of what you search for. However, quality teams frequently misinterpret this increased detection rate as evidence that the process is deteriorating or that a new failure mode has emerged in the PFMEA.
Consider a CNC machining cell producing transmission components. A customer rejects a shipment for a bore diameter variance of 0.008 millimetres outside specification. The quality team investigates, traces the variance to tool wear, and tightens inspection on that specific dimension. Within a week, they start finding the same variance across multiple stations.
The subsequent data review reveals the variance has been present at low levels for eighteen months. Nobody reported it previously because nobody was measuring for it. Now that inspectors are actively checking the dimension, the defect appears to be everywhere. The detection rate increased. The occurrence rate remained static.
This misinterpretation triggers a cascade of unnecessary corrective actions. Process changes introduce new risks. Equipment modifications create new failure modes. Each response generates its own anomalies, providing further justification for heightened vigilance. The cycle deepens until the organisation is spending premium resources on a stable process.
The Operational Cost of Detection Bias
The first cost of unchecked frequency illusion is overestimation. A variance present in 0.3% of parts starts to feel pervasive. The emotional impact of the customer rejection—the shock, the containment, the 8D investigation—amplifies the perceived prevalence. Decisions made under this amplified perception consistently overcorrect.

In the transmission component scenario, the quality team increased inspection from routine sampling to 100% sorting on the affected dimension. They added an extra quality gate and retrained operators. Over the next quarter, the cost of quality for that product line increased dramatically. The actual defect rate remained at 0.3%. The organisation was spending capital as if it were 30%.
The second cost is neglect. Attention is a finite resource. When an organisation pours its perceptual bandwidth into one defect category, other categories fade from awareness. Inspectors hyper-vigilant about bore diameter variances become less attentive to surface finish defects, burr formation, or material contamination.
Sensitivity to defect type A increases while sensitivity to types B through Z decreases. The overall defect detection rate does not improve. It often declines. The organisation fixates on a single failure mode while genuinely critical defects pass through the line undetected.
Separating Detection Rate from Occurrence Rate
The quality professional's antidote to frequency illusion is to rigorously separate detection rate from occurrence rate. Finding more defects does not mean more defects are occurring. It might mean you are looking harder. The only way to know is to control for inspection effort using statistical methods rather than emotional reactions.
Maintain a constant sampling plan. Use the same inspectors and apply identical acceptance criteria. If the underlying defect rate in the process has genuinely shifted, your SPC control charts will reflect the change regardless of who is looking. If the rate remains stable but reported defects surge, you are witnessing a detection artefact, not a process failure.
Maintaining this discipline is difficult. Once the frequency illusion takes hold, experienced quality engineers struggle to distinguish between seeing more and there being more to see. The bias operates at a pre-rational level. It shapes perception before conscious statistical analysis can intervene.
This is why maintaining a parallel inspection stream with the original sampling plan is critical. It serves as a control group. If your enhanced inspection finds a surge in defects but your control stream remains stable, you have hard evidence that the process is sound and the surge is purely perceptual.
| Indicator | Genuine Process Drift | Frequency Illusion |
|---|---|---|
| Underlying SPC data | Shifts outside control limits | Remains stable and predictable |
| Parallel sampling plan | Shows identical defect increase | Shows no change in defect rate |
| Neighbouring processes | May show correlated instability | Completely unaffected |
| Inspector behaviour | Finds defects across categories | Fixates on single defect type |
Harnessing Selective Attention as a Quality Tool
Despite the risks, the frequency illusion has a productive side. When harnessed deliberately, selective attention is a powerful mechanism for quality improvement. Targeted defect recognition training programmes essentially program the Baader-Meinhof response on purpose, directing inspectors to spot specific failures that untrained eyes would miss.
This mechanism drives focused improvement campaigns. When an organisation declares a targeted war on a specific failure mode, it deliberately triggers selective attention across the workforce. People start seeing and reporting the defect everywhere. The data becomes rich enough to act on, and the cross-functional awareness breaks down departmental silos.
New hires demonstrate the reverse of this phenomenon. They often notice problems that veterans have stopped seeing. Their perceptual filters have not yet adapted to treat the abnormal as normal. A fresh set of eyes on an assembly line is valuable precisely because those eyes have not yet learned to ignore the background noise.
The defect you see everywhere may not be everywhere. The defect you see nowhere may be everywhere.
Safety walkthroughs after an incident find hazards that were present for months. A good VDA 6.3 auditor can walk a production floor and immediately identify problems that the floor's own operators have become blind to. The key is deploying this heightened attention deliberately, then withdrawing it before it calcifies into permanent paranoia.
Managing Customer-Side Frequency Illusion
The frequency illusion does not stay confined to your factory floor. When a customer finds a defect in your product, they undergo the same perceptual shift your internal team experiences. They start looking for that specific failure in every subsequent shipment, finding it in places they never inspected before.
This customer-side distortion is dangerous because you cannot train their inspectors or calibrate their perception. You can only respond to an escalating stream of complaints, rejections, and 8D demands. Each rejection reinforces their conviction that the problem is systemic, even when your internal data confirms the original defect was an isolated anomaly.
In regulated industries such as aerospace and medical devices, this dynamic triggers official scrutiny. A customer complaint pattern resembling a systemic failure attracts auditors and regulatory bodies. Each regulatory investigation generates its own findings, adding another layer of amplified scrutiny to your operations.
Proactive communication is your only defence. When you report a defect to a customer, provide the baseline data and the statistical context immediately. Show them the occurrence rate alongside the detection rate. Frame the conversation around facts before their perception spirals into suspicion.
Containment Protocol for Heightened Defect Detection
- 01Acknowledge the biasExplicitly name the frequency illusion during the investigation kickoff.
- 02Establish baselinePull historical SPC data to determine the actual occurrence rate.
- 03Parallel inspectionRun enhanced checks alongside the original sampling plan as a control.
- 04Monitor adjacent processesTrack defect types B through Z for collateral neglect.
- 05Set time boundaryDefine the duration for enhanced scrutiny before reverting to standard sampling.
Preventing Perceptual Distortion from Becoming Policy
When a team discovers a new defect and organisational reaction begins to escalate, explicitly acknowledge the cognitive bias. State plainly that inspectors will start seeing this defect everywhere and that vigilance does not equate to prevalence. Naming the distortion reduces its power. People who know their perception is being compromised can actively compensate.
Before launching corrective actions, establish a statistically valid baseline. Determine the actual defect rate using historical control charts. Verify whether the process has changed or whether the detection capability has changed. This baseline anchors the team, providing a factual counterweight to the emotional urgency of a customer rejection.
Document any changes to inspection effort. If you increase sampling frequency for a newly discovered defect, track the increased effort alongside the increased findings. This discipline allows you to separate the effect of looking harder from genuine process deterioration. Without this tracking, the cost of quality will inflate invisibly.
Set a firm time boundary for heightened scrutiny. Commit to running enhanced inspection for 90 days, then evaluate the data and return to normal sampling if the defect rate remains stable. Without a predefined exit strategy, the new vigilance calcifies into the new normal, and the 100% inspection costs become permanently embedded in your operating budget.
Discipline Metrics for Defect Response
Building Systems That Account for Perception
Quality data is never a pure reflection of the manufacturing process. It is a reflection of the process filtered through human perception, and human perception is subject to systematic biases that make data misleading. The defect you see everywhere may be isolated. The trend you believe is insignificant may be the most critical signal in your data set.
Organisations that take quality seriously are the most susceptible to frequency illusion. They investigate anomalies, share findings broadly, and train their inspectors rigorously. These commendable practices are exactly what make them vulnerable to overreaction. The diligence that drives excellence also drives paranoia if left unchecked.
I have implemented ISO 9001 systems across automotive and aerospace plants, and the pattern is consistent everywhere. The most effective quality leaders treat every defect discovery as both a genuine finding and a potential perceptual trigger. They manage the defect itself alongside the organisation's psychological response to the defect.
Seeing more defects is not the same as knowing more about your process. The critical quality skill is not the ability to detect defects but the ability to interpret what that detection actually means. Rigorous statistical discipline must govern the response, ensuring that perception never overrides evidence on the shop floor.