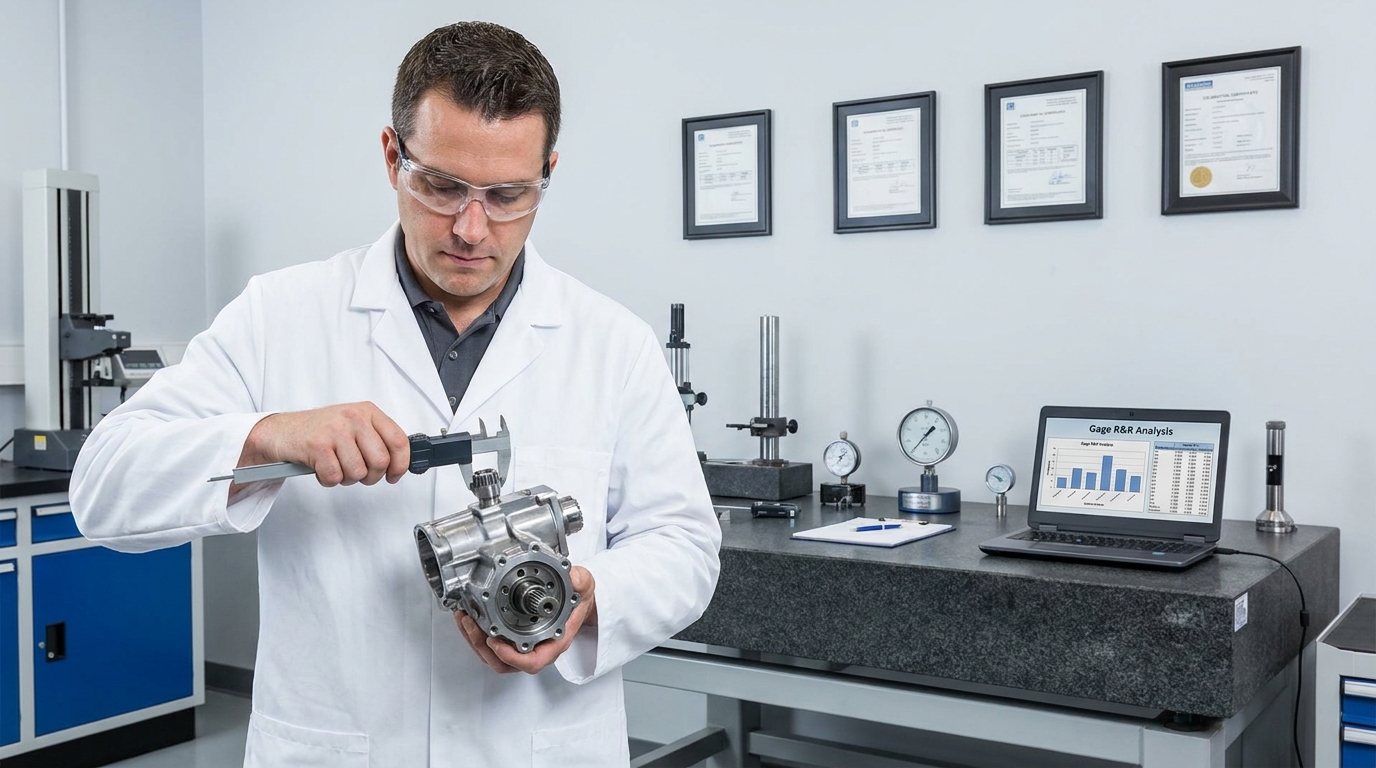
A manufacturing director called me in to review a milling process that appeared to be completely out of control. The tolerance was ±0.15 mm, but the data points on the SPC chart scattered across the entire width of the control limits. He was ready to sign a capital request for a new machining centre, convinced the existing technology had degraded beyond repair.
I looked at his monitor, where four recent measurements of the exact same workpiece yielded four distinctly different results. The spread between the highest and lowest values was nearly two millimetres. I asked him one question: how do you know the problem is in the process, and not in the gauge you are using to measure it?
This article is about Gage Repeatability and Reproducibility (R&R). It is the core discipline of Measurement System Analysis (MSA) that allows you to separate actual product variation from the noise generated by your measurement equipment, your fixtures, and your operators.
The Mechanics of Gage R&R
Gage R&R systematically isolates the variation introduced by the measurement process itself. It does not evaluate the product; it evaluates the system you use to evaluate the product. If your measurement system variance is high, the data driving your SPC charts and scrap reports is functionally meaningless.
The study breaks total measurement variation into two specific components. Repeatability evaluates the inherent precision of the gauge when one operator measures the same part multiple times under identical conditions. Reproducibility evaluates the variation introduced when different operators measure the same part using the same gauge.
High repeatability variation points to a hardware failure: a worn contact point, insufficient fixture rigidity, or a gauge lacking the necessary resolution. High reproducibility variation points to a methodology failure: operators using different clamping forces, inconsistent probing angles, or poorly written visual inspection standards.
Acceptance Criteria and the AIAG Standard
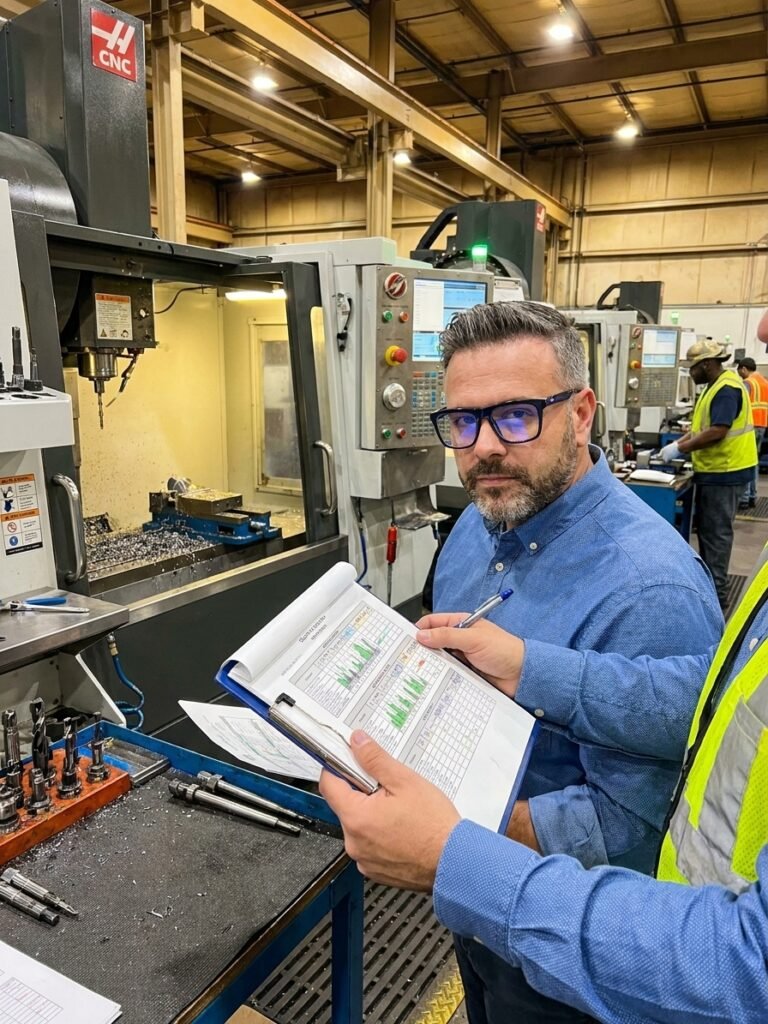
The Automotive Industry Action Group (AIAG) methodology is the industry standard for structuring these studies. You select a sample of ten parts that span the full operational range of your process, engage three operators who routinely use the gauge, and have each operator measure each part three times in a randomized, blind sequence.
This generates 90 data points. You then use ANOVA or the Range method to calculate the percentage of total study variation consumed by the measurement system. The output provides a statistical hierarchy that dictates whether you can trust the gauge for production decisions.
If your Gage R&R percentage falls between 10 and 30 percent, the gauge may be acceptable depending on the application, the criticality of the characteristic, and the cost of improving the system. Above 30 percent, the system is unacceptable and will actively obscure your true process capability.
AIAG Acceptance Thresholds
The Slovakia Milling Case Study
I ran the AIAG study on that automotive supplier's milling process. The results were definitive. The Gage R&R accounted for 62 percent of the total observed variation. Over half the chaos on their SPC chart was generated purely by a worn vernier caliper and inconsistent operator measuring force.
When we broke down the reproducibility data, we found that one specific operator systematically measured 0.04 mm higher than his colleagues. The gauge required a specific, consistent closing force, and that technique had never been standardized during his onboarding. His data was perfectly consistent with his technique, but entirely wrong for the application.
The resolution was a few hundred euros in hardware and two hours of training. We replaced the caliper probe, implemented a standardized constant-force holder, and retrained all three operators on the clamping technique. We reran the study, and the Gage R&R dropped to 8 percent.
The process capability index immediately shifted from a terrifying 0.9 to a robust 1.8. The machine had never needed replacing. The supplier had almost committed capital expenditure because they failed to validate their measurement system.
Measurement noise actively masks true process capability, driving unnecessary capital expenditure.
Crossed vs Nested Study Design
Choosing the wrong statistical design for your MSA study will invalidate the results entirely. The standard AIAG approach is a crossed design, where every operator measures the exact same set of parts. This works perfectly for dimensional checks, weigh checks, and non-destructive testing.
Crossed designs fail completely during destructive testing. If you are validating a weld tensile strength test, the part is destroyed during the first measurement. The second operator cannot measure the same part because it no longer exists in its original state.
For destructive testing, you must use a nested Gage R&R design. In this structure, each operator measures a unique set of parts drawn from the same homogeneous production batch. The statistical model assumes the batch variation is negligible compared to the measurement variation, allowing you to isolate operator and gauge effects.
Crossed vs Nested MSA Designs
Crossed Design
- Used for non-destructive testing
- Every operator measures the exact same parts
- Standard approach for calipers and CMMs
- Fails completely if the part is destroyed
Nested Design
- Mandatory for destructive testing
- Operators measure different parts from one batch
- Requires strict batch homogeneity assumptions
- Isolates gauge variation without part reuse
Attribute Gage R&R for Pass/Fail Inspection
Measurement System Analysis is not limited to continuous variable data like lengths and weights. Visual inspections, go/no-go gauges, and functional pass/fail tests are attribute measurements, and they require the same rigorous validation to ensure inspectors are making reliable decisions.
I once audited a printed circuit board manufacturer experiencing high escape rates on visual solder joint inspection. One inspector would flag a joint as defective, while another would pass it. The root cause was a set of subjective, text-based work instructions that left room for individual interpretation.
We ran an Attribute Gage R&R using 30 samples containing clearly acceptable parts, clearly defective parts, and borderline cases. The initial effectiveness rate was barely 60 percent. We replaced the written standard with a visual boundary book containing high-resolution photographs of acceptable and unacceptable solder profiles.
After implementing visual standards and retraining the inspectors, the Attribute Gage R&R effectiveness rate exceeded 95 percent. When attribute measurement systems lack physical or visual boundary examples, operators are forced to guess, and your defect data becomes random noise.
Common MSA Implementation Failures
Engineers frequently invalidate their own MSA data by skewing the sample selection. If you select ten perfectly machined, ideal parts for your study, you artificially restrict the process variation. This mathematical limitation causes the Gage R&R percentage to skyrocket, falsely condemning a perfectly functional measurement system.
Another critical failure is ignoring operator memory during the trial. If an operator knows they are measuring part number three, and they remember measuring 1.05 mm last time, they will subconsciously bias their technique to match that number. The presentation order of the parts must be completely randomized and blinded.
Finally, a measurement system is dynamic, not static. Gauge tips wear, fixtures loosen, and personnel turnover introduces new techniques. IATF 16949 auditors expect to see Gage R&R studies updated whenever a new gauge is introduced, a critical change occurs, or during annual quality system reviews for critical characteristics.
Software like Minitab or JMP will execute the complex ANOVA mathematics instantly. But relying on the software without understanding the underlying statistical principles is a liability. You must know how to interpret operator-part interactions and diagnose the physical root causes behind the numbers.