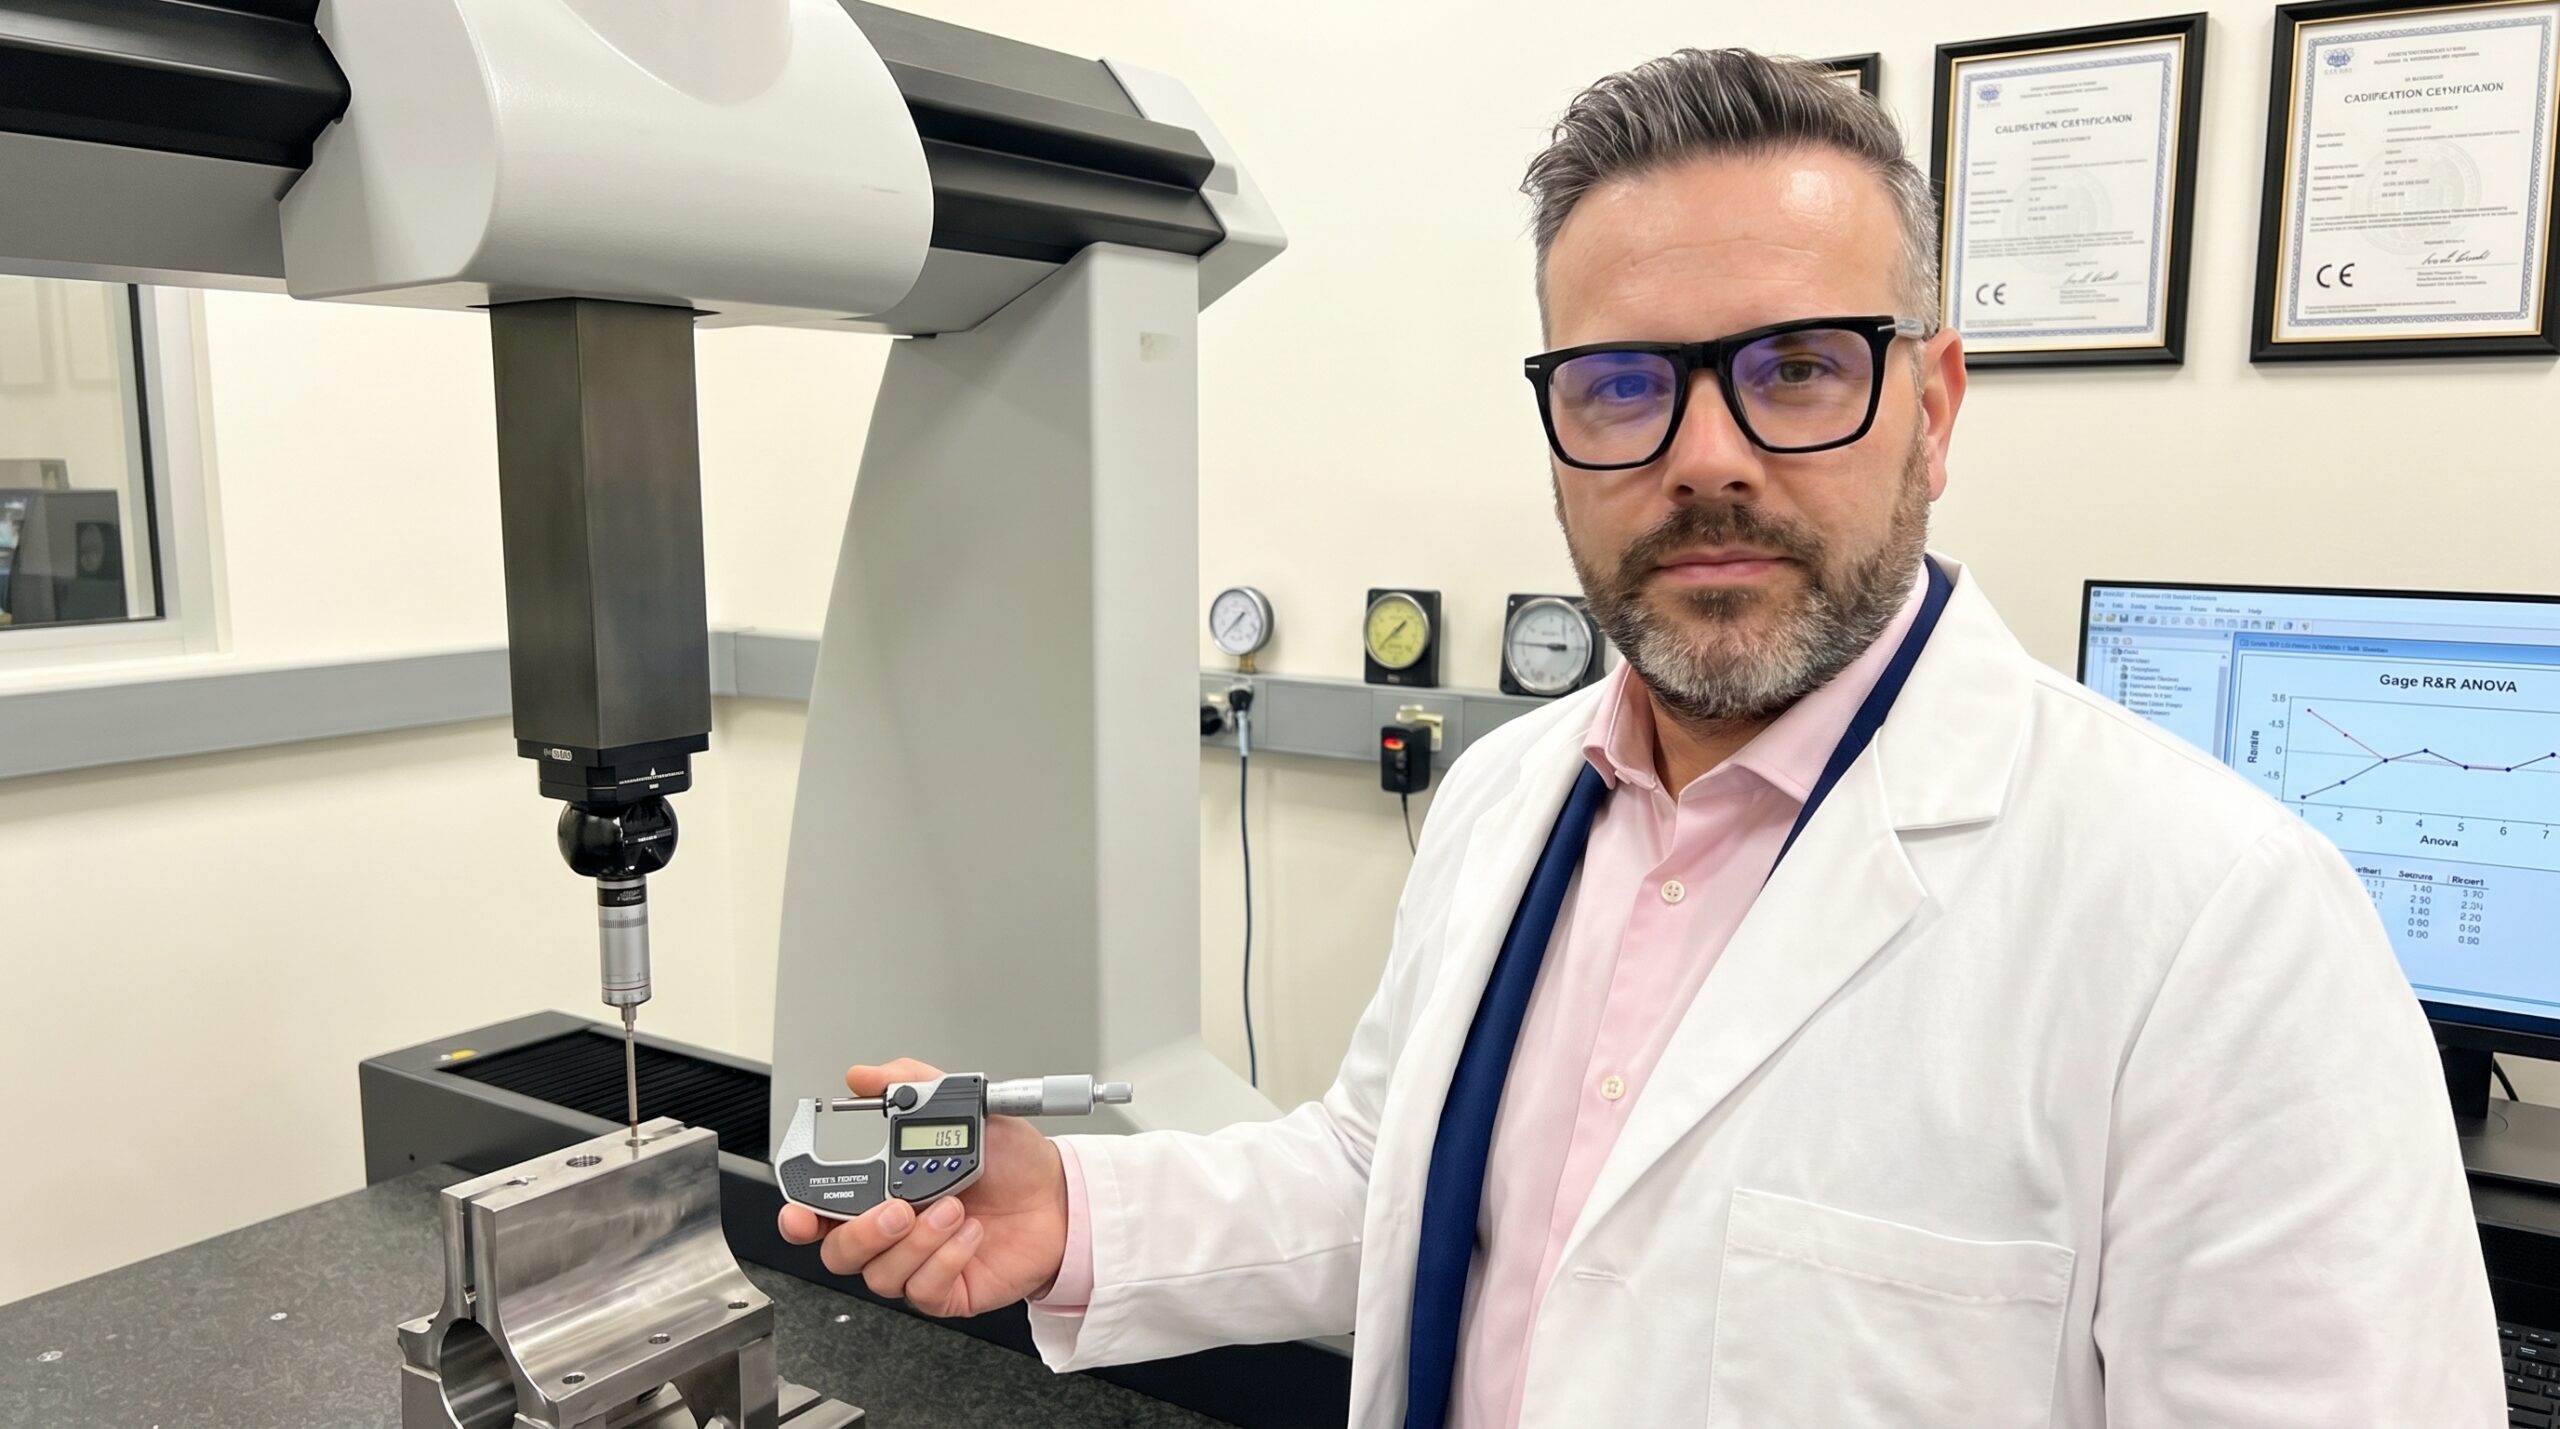
Three coordinate measuring machines measuring the identical automotive part, each yielding a different result. The spread was 12 micrometres on a component with a 50-micrometre tolerance. The customer was threatening to halt deliveries, and the plant manager was staring at a shutdown.
The measurement system was consuming nearly 25% of the tolerance before anyone even addressed production variability. I have audited dozens of plants over the last 20 years where leadership confidently made scrap and acceptance decisions based on data generated by unverified measurement systems.
When we ran the Gage R&R study at that plant, the results were damning. Total measurement system variation stood at 42%. Operators used different techniques to tighten the holding fixture, two gauges were drifting out of calibration, and one inspector systematically skewed readings by ignoring thermal compensation. Their data was an illusion.
What Gage R&R Actually Measures
Gage R&R (Repeatability and Reproducibility) is a systematic method to quantify the variation introduced by your measurement process. It decomposes the total observed variation in your readings, isolating how much stems from the actual parts versus how much is simply noise generated by the gauge and the operators.
The method breaks measurement variation into two hard categories. Repeatability assesses whether the same operator using the same gauge gets the identical result across multiple trials on the same part. Reproducibility evaluates whether different operators can achieve the same result on that identical part.
Neither concept is a theoretical luxury. They are baseline requirements of IATF 16949 and the AIAG MSA manual. If you have not verified repeatability and reproducibility, every accept or reject decision you make on the shop floor is a coin toss. You are reacting to measurement noise rather than actual part deviation.
The Broader MSA Foundation
Gage R&R is the most critical component of Measurement Systems Analysis, but it only evaluates precision. It does not verify accuracy, which requires a separate bias study to confirm the average of your readings matches a traceable reference standard. Calibration certificates guarantee bias control, not precision.
You must also assess linearity to ensure the gauge's error remains constant across its entire measuring range, not just at a single calibration point. A micrometre might be perfectly accurate at 10 mm but drift systematically at 50 mm, a failure mode that destroys confidence in wide-tolerance applications.
Finally, stability studies track whether the measurement system's statistical properties shift over time. A gauge calibrated today might drift in three months due to mechanical wear or environmental changes. Gage R&R tells you how tight your shot group is; accuracy tells you if you hit the centre of the target.
Designing the Study
The AIAG manual outlines three statistical approaches. While the Average and Range method remains common in automotive due to its simplicity, I mandate the ANOVA method. ANOVA is statistically robust and isolates the interaction between operators and parts, a hidden failure mode the simpler average calculations completely ignore.
The standard experiment requires three operators, ten parts, and three trial runs per part, totalling 90 measurements. The critical failure point is part selection. If operators pull ten consecutive parts from a single stable batch, the study lacks realistic part variation and artificially inflates the error percentage.
ANOVA-Based Gage R&R Execution
- 01Part SelectionSample components across different shifts and batches, deliberately including parts near the upper and lower specification limits.
- 02Blind IdentificationMark parts internally so the operator cannot identify them, preventing subconscious adjustments toward previous readings.
- 03Randomised TrialsOperators measure parts in randomised order across multiple independent trials to prevent pattern memorisation.
- 04ANOVA EvaluationInput the 90 data points into statistical software to isolate part variation, operator bias, and gauge repeatability.
Interpreting the Mathematical Thresholds
Once the data is collected, the calculations yield hard metrics that govern your production status. The primary gate is %GRR, which expresses measurement system variation as a percentage of total observed variation. This single number dictates whether you can trust your process data.
Equipment Variation (%EV) isolates the gauge itself. High %EV points to mechanical wear, inadequate fixture rigidity, or an instrument lacking the necessary resolution for the tolerance. Appraiser Variation (%AV) isolates the operators, where high numbers expose inadequate training, vague work instructions, or inconsistent measurement technique.
Core Gage R&R Acceptance Criteria
Anatomy of a 42% Failure
When we dismantled the 42% failure at the Slovakian automotive plant, the root causes were entirely mechanical and procedural. The holding fixture had no defined torque, leaving operators to clamp parts by feel. This introduced massive reproducibility errors, as each operator compressed the part differently.
The calibration records were technically pristine, but the gauges were calibrated in a controlled 20°C lab while the shop floor operated at 32°C. The metal components expanded, introducing a systematic bias. We resolved this by implementing localized calibration at the line's ambient temperature and enforcing thermal compensation protocols.
The third failure was operator technique. One inspector applied excessive pressure on the gauge probe, flexing the thin component wall and generating false readings. We standardised the procedure with a torque-limited fixture, implemented a photographic work instruction, and retrained the team.
Calibration guarantees a gauge hits the target. Gage R&R proves it can hit the same spot twice.
Following these corrections, %GRR plummeted from 42% to 7.8%. The Number of Distinct Categories surged from 3 to 14, exceeding the AIAG requirement of 5. The customer retracted the shutdown threat because the plant could finally prove their inspection data accurately reflected reality.
Attribute Studies and Core Tool Integration
Variable data is straightforward, but visual and pass/fail inspections require Attribute Gage R&R. This method evaluates effectiveness, false alarm rates, and miss rates. I have audited visual inspection stations with a miss rate of 18%, meaning one in five defective parts was passing directly to the customer.
Variable vs. Attribute Measurement Analysis
Variable Gage R&R
- Outputs continuous data (mm, Newtons, ohms)
- Requires 10 parts, 3 operators, 3 trials
- Metrics: %GRR, %EV, %AV, NDC
Attribute Agreement Analysis
- Outputs binary data (Pass/Fail, OK/NOK)
- Requires 30 parts, 3 operators, 3 trials
- Metrics: Effectiveness, Miss Rate, False Alarm Rate
MSA is not a standalone exercise. It underpins the entire automotive quality framework. Within PPAP, you must prove your measurement systems are capable before submitting production part approval. Statistical Process Control (SPC) is mathematically invalid if generated by an unverified gauge.
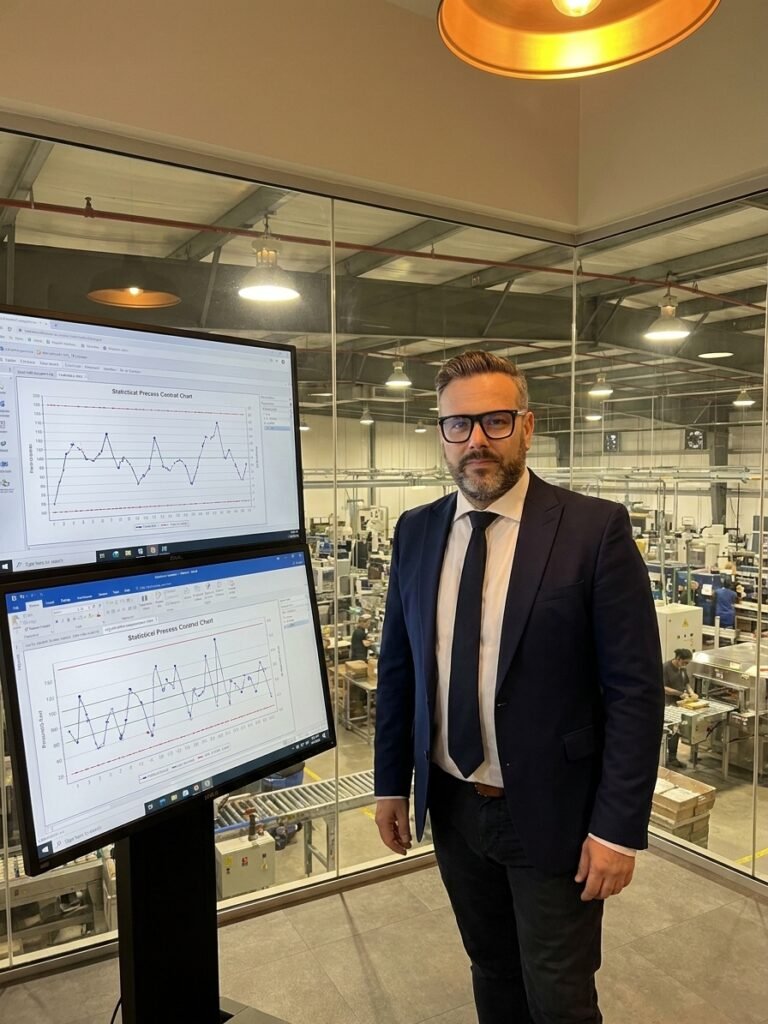
A control chart built on noisy data will trigger false alarms and mask actual process shifts. Without MSA, deploying SPC is like navigating a ship with a compass that is 30 degrees off true north. You will confidently steer directly into a field of scrap while your metrics tell you everything is in control.
Execute the study during the APQP phase, not the week before PPAP submission. Run it again annually, and re-run it whenever you introduce a new operator, a new gauge, or a new part variation. Measurement systems decay, and the only way to catch the drift is to measure the measurement.