I was reviewing monthly quality reports with a plant manager who was genuinely proud of his numbers. First-pass yield sat at 97.3%. Customer complaints were down 12% quarter over quarter. Scrap rate was within target. Everything was green on the dashboard.
Yet his largest customer had just issued a formal warning about delivery consistency. The shipping logs on his second monitor looked flawless. The data was accurate. The data was also irrelevant to the customer's actual experience.
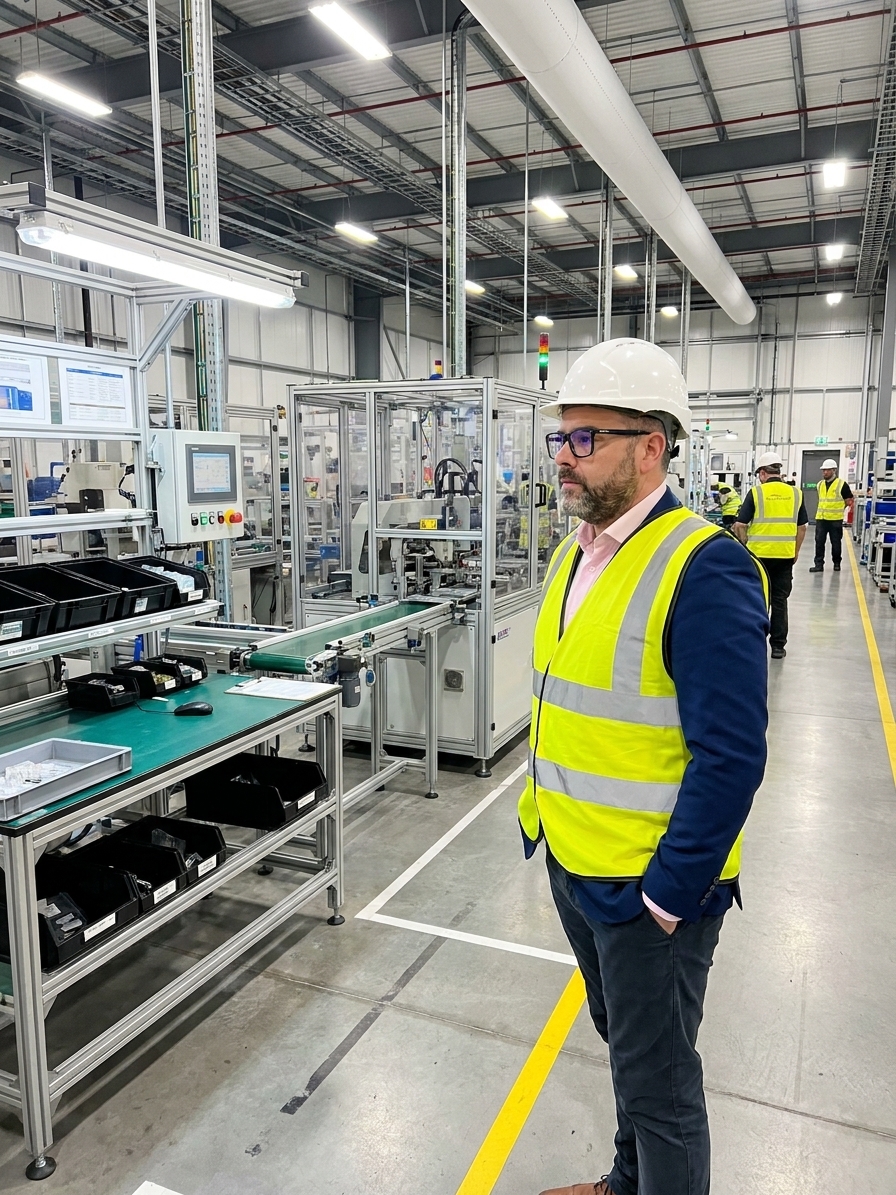
When we walked the assembly line, the truth was immediately visible. Operators were building a buffer of finished goods before each break to mask intermittent line stoppages during shift changes. Those buffers smoothed the hourly output averages but guaranteed that daily shipments arrived erratically, destroying the customer's production planning.
No spreadsheet would have revealed this. No KPI dashboard would have flagged it. This is the Gemba gap: the distance between what your reporting system captures and what is actually happening at the point of production. It is the single most expensive blind spot in modern quality management.
What Gemba Actually Means in a Quality Context
Gemba is a Japanese term meaning the actual place. In manufacturing quality management, it refers strictly to the factory floor where value is added. The principle is universal across ISO 9001 and IATF 16949 environments: you must go to where the work happens to understand the process.
Taiichi Ohno, one of the architects of the Toyota Production System, would draw a chalk circle on the factory floor and instruct new managers to stand in it for hours. They were told to observe without analyzing, solving, or suggesting. The goal was to develop the ability to see waste with their own eyes before attempting to engineer it out of the system.
This practice, known as the Ohno Circle, holds a critical insight that most organizations miss during quality audits. The purpose of Gemba is not to gather data for a VDA 6.3 report. The purpose is to develop the observational skills required to see process deviations that standard metrics cannot capture.
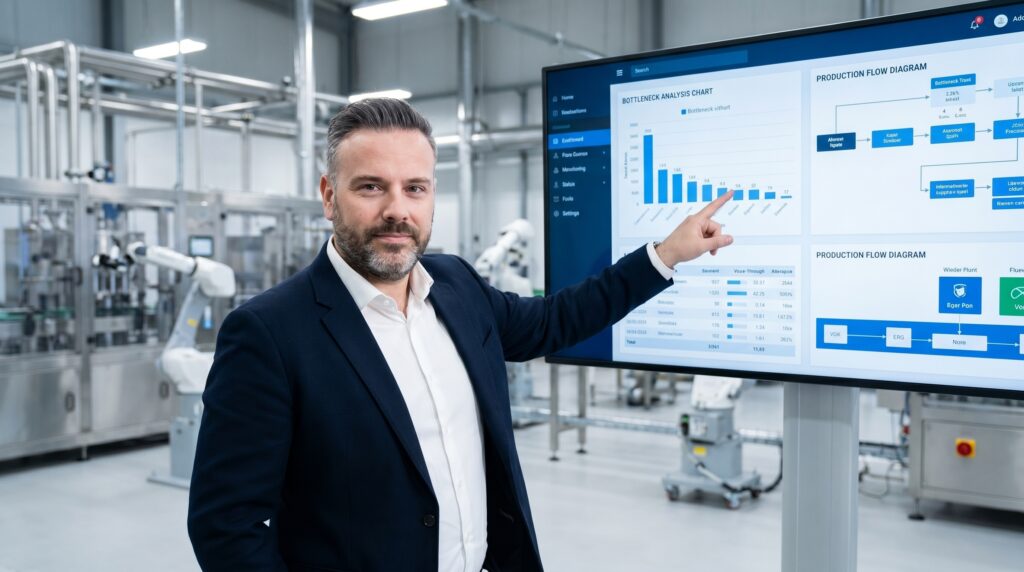
The Gemba Misconception vs. the Gemba Discipline
What teams mistakenly do
- Treat it as an audit with a clipboard looking for violations to document
- Conduct a factory tour for visitors or VIPs rather than a working session
- Solve operator problems on the spot, turning the walk into a mobile command center
- Run it as an isolated quarterly event to show management visibility
What effective leaders do
- Conduct structured observation to understand actual versus reported conditions
- Use it as a leadership development ritual to build process awareness
- Identify waste, abnormalities, and unspoken improvement opportunities
- Signal that the floor is the primary source of process truth, not the meeting room
The Three Levels of Process Observation
Most managers who visit the production floor see nothing of value. They lack the trained eye to identify deviations from standard work. Effective Gemba observation operates at three distinct levels, each requiring progressively more technical discipline and manufacturing experience.
Level 1 is seeing the obvious. You notice safety hazards, 5S violations, and clear bottlenecks. You see material piled up where it should not be and operators waiting for parts. This level is valuable for housekeeping but superficial for quality engineering. Anyone with basic awareness can do it.
Level 2 is seeing the process. You begin to understand material flow. You see where work accumulates and where variation enters the process. You notice that an operator follows standard work exactly while another has developed undocumented personal shortcuts. You spot fixtures worn beyond their calibration tolerance that nobody flagged because the parts still pass inspection.
Level 3 is seeing the system. You understand how physical layout drives specific behaviors and how incentive structures create waste. You recognize that the problem is not the operator or the machine, but the system that shapes how they interact. You see the invisible: the information gaps, the decision delays, and the feedback loops that fail to close.
The Architecture of a Meaningful Walk
A Gemba Walk that produces actionable engineering insight rather than management theater requires rigid structure. I have refined this framework across implementations at organizations operating under AS9100 and IATF 16949 standards. It demands preparation before stepping onto the floor, discipline during the walk, and immediate documentation afterward.
Never walk onto the floor cold. Spend fifteen minutes reviewing yesterday's production issues, open CAPA items, and active quality alerts. Crucially, review the standard work documentation for the processes you intend to observe. You cannot identify process deviation if you do not know the established standard.
Define a specific technical focus for each walk. Looking for improvement opportunities is a meaningless objective. Observing the changeover process on Line 2 to understand why it takes 45 minutes when the PFMEA and standard work specify 20 minutes gives your observation a clear target and measurable boundary.
During the walk, observe but do not orchestrate. The most common managerial mistake is solving problems in real time. When a manager immediately issues a directive to an operator mentioning an issue, it transforms a Gemba Walk into a mobile command center. It teaches the organization that complaining when the boss walks by is the fastest way to get resources allocated.
What Gemba Reveals That Data Conceals
Data aggregation enables statistical analysis at scale, but it eliminates the context that gives that data meaning. A Gemba Walk restores the context. Consistently, the floor reveals critical failure modes that no monthly quality report will ever surface to management.
You will find workarounds that became informal standards. Operators develop unauthorized methods to bypass systemic problems. Over time, these become accepted practice. Nobody documents, validates, or risk-assesses them against the formal PPAP requirements. Yet they dictate how the work is actually executed, introducing variation the process was designed to eliminate.
You will identify equipment deterioration that happens between calibrations. Machines drift. Fixtures wear. The validated process from your last MSA study is not the same process running today. Controls checked periodically during audits are wrongly assumed to be controlled continuously on the floor.
A process that is physically difficult to follow correctly will be followed incorrectly. Every single time.
You will see the human cost of poor process design. Ergonomic strain, cognitive overload, and awkward postures are entirely invisible in quality metrics. Yet they are the root cause of inconsistent output and dimensional variation. If a process requires an operator to contort to install a fastener, the torque application will be inconsistent. The 8D report will blame the operator. The Gemba observation will blame the station layout.
The Failure Modes of Floor Observation
Over two decades of walking factory floors, I have identified consistent failure modes that transform a powerful engineering practice into empty management ritual. Recognizing these patterns is the first step to building a sustainable quality culture.
The drive-by is the most common failure. Managers walk through at high speed, nodding at operators without stopping or asking questions. This is factory tourism, not process observation. It signals to the organization that the floor is a corridor to be passed through, not a source of data to be studied.
The report graveyard is the most damaging. Managers document observations that disappear into a filing system and never trigger corrective action or continuous improvement. Within three walks, the organization learns that Gemba observations do not matter. Operators stop sharing valuable intelligence and revert to waiting for the audit team.
The executive exception kills the initiative entirely. When senior leaders exempt themselves from the practice, no one takes it seriously. If the Quality Director or Plant Manager does not walk the Gemba, the behavior dies on the shop floor. The behavior you model is the quality culture you build, regardless of what your manual states.
The Post-Walk Documentation Sequence
- 01Calibrate what worksDocument three specific things functioning exactly to standard. This establishes a baseline for what good looks like before identifying failures.
- 02Document precise deviationsRecord three concerns with total specificity. Not 'housekeeping needs work' but 'four unmarked containers of fasteners at Station 7 with no lot traceability.'
- 03Assign follow-up investigationIdentify the single most critical question raised and assign it to an engineer for root cause investigation. Gemba raises questions; engineering provides answers.
Building a Floor-Oriented Quality Culture
The ultimate goal is not to have managers who occasionally walk the floor. It is to build an organization where every engineer and quality professional goes to Gemba instinctively when a problem arises. Where troubleshooting a dimensional defect does not happen behind a desk reviewing Cpk reports.
This requires a fundamental shift in how your organization treats knowledge. In most companies, knowledge lives in controlled documents, ERP databases, and CAPA meeting rooms. In a Gemba-oriented organization, knowledge lives in the work itself. The fastest, most accurate way to access it is to stand at the point of production and observe the process.
Start small and be consistent. Walk the floor for thirty minutes this week. Pick one specific process relevant to an open quality alert. Watch it. Ask operators about it. Write down three specific observations and track them to closure. Repeat this discipline weekly.
Within three months, your dashboards will start looking different. Not because the aggregated numbers changed, but because you will finally understand the physical reality those numbers represent. Reports can be massaged and metrics can be gamed. The factory floor does not lie.