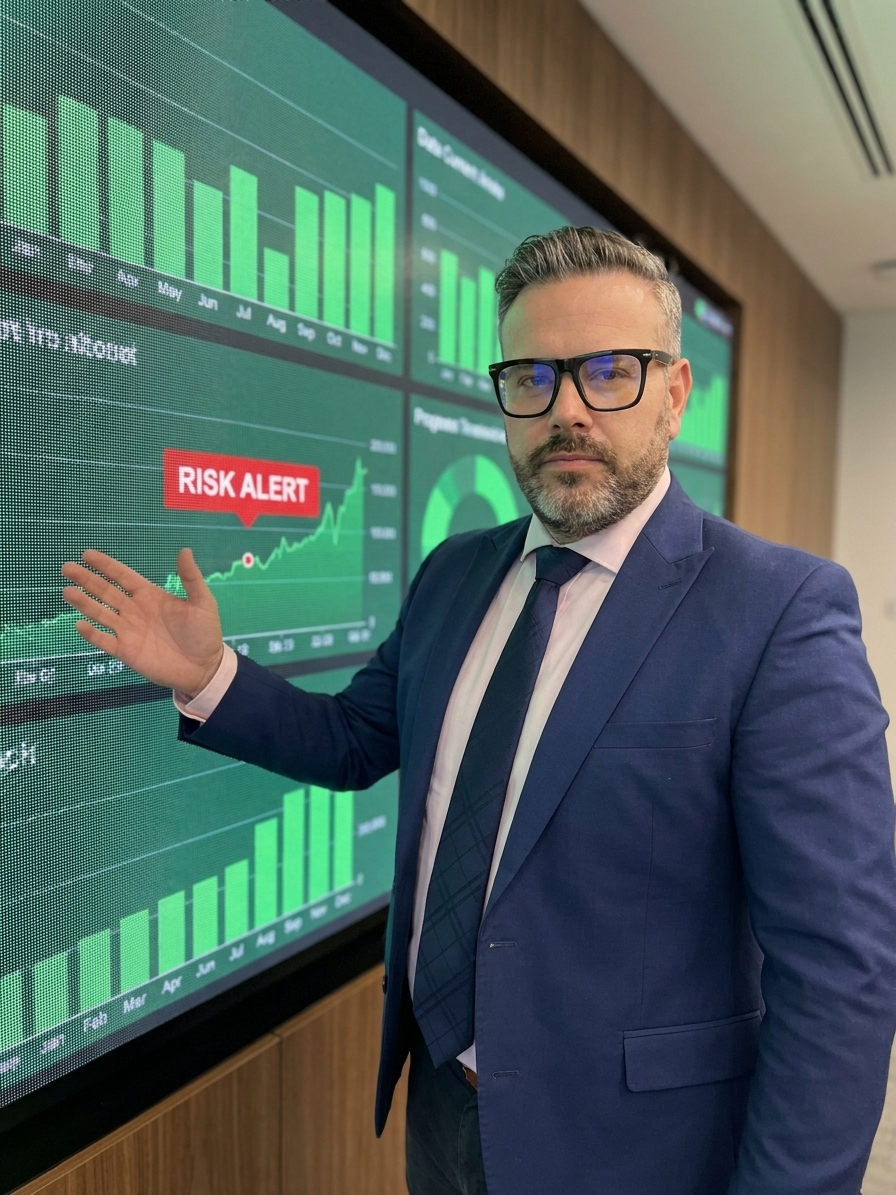
A 94% OEE and a sub-50 PPM rate buy a quality director enormous political capital. They also buy something more dangerous: a cognitive blind spot. When one headline metric glows green, the human brain systematically relaxes scrutiny on the processes sustaining it. Psychologists call this the Halo Effect, and it is quietly dismantling quality infrastructure in plants that believe they are performing well.
I have audited plants where final-product defect rates were genuinely excellent but incoming inspection sample sizes had been quietly halved over eighteen months. The downstream metrics were still green, so nobody questioned the upstream erosion. The FDA and EASA do not care about your downstream metrics. They look at the system. When the system has a gap, a clean PPM history will not save you from a warning letter or a corrective action request.
The mechanism is unconscious and fast. A supplier with immaculate documentation and a 95/100 audit score gets assumed to have robust process control. A production manager with strong output numbers gets assumed to run a tight quality operation. None of these inferences are necessarily true. But in organisational decision-making, feeling true is often enough to shut down the questions that matter.
How the Halo Effect Distorts Quality Reviews
Edward Thorndike documented the Halo Effect in 1920 when he found that military officers who rated soldiers highly on physical appearance also rated them highly on unrelated traits like intelligence and leadership. One positive impression created a glow that coloured everything else. A century later, the same cognitive shortcut governs how management committees evaluate quality performance.
The metric halo is the most dangerous variant because it disguises itself as analytical rigour. Your organisation tracks OEE, PPM, cost of poor quality, first-pass yield, CAPA closure, audit findings, training compliance, and calibration status. But one or two of those metrics become the face of your quality programme, usually because they are the ones tied to executive bonuses or the ones that historically caused the most customer pain.
Once that metric glows green, every other metric gets evaluated in its light. If the headline number is strong, the assumption ripples outward that the fundamentals must be sound. People stop asking uncomfortable questions about the metrics that are not on the executive dashboard, or the ones that are technically visible but nobody actually examines. The halo from lagging indicators masks the deterioration of leading indicators.
This is how organisations get blindsided. The warning signs were visible the entire time, but the glow from the impressive numbers made them feel less significant. A 71% CAPA closure rate does not trigger alarm when OEE is at 93%. It should.

The Four Vectors of Halo Contamination
The halo does not arrive through negligence. It seeps in through the normal, well-intentioned processes organisations use to evaluate performance. Recognising the vectors is the first step to building countermeasures.
Halo Vectors in Quality Systems
Where the halo appears
- Metric halo: OEE at 93% makes CAPA closure at 71% feel acceptable
- Supplier halo: a 95/100 audit score weakens receiving inspection rigour
- Manager halo: strong output numbers protect quality gaps from investigation
- Certification halo: ISO 9001 certificate substitutes for daily system discipline
What it actually means
- Lagging indicators are masking leading-indicator failure
- Minor deviations from "good" suppliers are dismissed as anomalies
- Customer complaints are attributed to external factors, not process
- Process audits and internal calibration checks erode because they feel unnecessary
Leading Versus Lagging: The Arithmetic of Decay
Consider the typical automotive tier-one plant tracking eight quality metrics. Scrap rate sits at 0.8% against a 1.5% target. Customer PPM is 23 against a 50 limit. OEE is 93.4%. All three are green and they dominate the monthly executive dashboard. Meanwhile, CAPA closure is at 71% against a 90% target, audit-finding closure is at 78%, and training compliance is at 84%.
The three green metrics are lagging indicators. They tell you what happened last month. The red metrics are leading indicators. CAPA closure rate, audit-finding closure, training compliance, and calibration on-time performance are the infrastructure that keeps the lagging indicators green. When leading indicators deteriorate, lagging indicators follow with a delay that can stretch across two or three quarters.
The Halo Effect means the green glow of the lagging indicators makes the red leading indicators feel less urgent. Management believes they will get to the infrastructure metrics later because the big three are strong. By the time the lagging indicators finally reflect the infrastructural decay, the organisation faces a systemic problem that takes months to correct rather than a localised issue that takes weeks.
I introduced routing verification KPIs at a major aerospace manufacturer specifically to break this pattern. By tracking lead-time and verification-process indicators alongside final-output metrics, we cut internal lead time by 97%. The key was making leading indicators visible at the same level of authority as the lagging ones, so the halo could not form in the gap between them.
The Supplier Audit Trap
Supplier quality management is acutely vulnerable to the Halo Effect. You audit a supplier, they score 95 out of 100, their documentation is immaculate, and their quality manager is articulate and clearly in command. Six months later, you discover they have been shipping non-conforming material because a calibration technician was falsifying records.
The initial audit score formed a halo. Subsequent receiving inspections became less rigorous because inspectors subconsciously knew this was a good supplier. The escalation criteria for non-conformances were applied less stringently. Minor deviations that should have triggered a corrective action request were dismissed as one-off anomalies because the supplier scored 95 on the last audit.
The green final-product metrics made people feel safe, and in that safety they dismantled the process creating the safety.
For critical suppliers, implement a fresh-eyes review every two years. Assign someone who was not involved in the original qualification to conduct a focused assessment. The question is not whether the supplier still meets the standard on paper. The question is what has changed since the last assessment. A person arriving without the halo sees the facility as it is today, not as it was remembered three years ago.
A Practical Framework for Breaking the Halo
The Halo Effect is a feature of human cognition, not a bug. You cannot eliminate it through training or awareness. What you can do is build organisational systems that compensate for it through structural design.
Anti-Halo Review Sequence
- 01Lead with the worst metricOpen every review with the lowest-performing KPI to set an honest emotional context before celebrating progress.
- 02Pair lagging with leadingPlace customer PPM next to CAPA closure, scrap rate next to training compliance, to create cognitive tension.
- 03Assign devil's advocateRotate a formal role tasked with challenging the positive narrative and asking what the dashboard is hiding.
- 04Run perception auditsCompare stakeholder ratings to actual data quarterly; where perception exceeds reality, the halo is active.
Most organisations build a quality narrative anchored to one or two headline metrics. Break that habit deliberately. In every quality review, start with the metric that is performing worst. This is not pessimism; it is structural honesty. You are establishing the real context before the positive numbers create emotional comfort that dulls critical thinking.
Cross-metric tension is the most effective structural defence. On your quality dashboard, physically place lagging indicators next to the leading indicators that predict them. When OEE at 93% sits directly beside calibration on-time at 91%, the visual proximity forces the question: how can our output be this good when our infrastructure is this weak? The cognitive dissonance is the point.
Building Systems That See Past the Glow
The certification halo may be the most pervasive vector of all. ISO 9001, IATF 16949, and AS9100 certificates hang in the lobby and appear in every supplier qualification package. They create an organisational assumption that quality is under control because an external auditor signed off. Under that assumption, the daily discipline of process audits, management reviews, and internal calibration checks gradually erodes.
Build a rotating audit focus into your annual internal audit plan. Instead of auditing the same areas with the same depth every cycle, deliberately vary the focus. One quarter, audit the processes that are performing well, not to confirm they are working but to verify they are working for the right reasons. The next quarter, audit the infrastructure processes that never appear on executive dashboards but determine whether the dashboard metrics stay green.
Periodically conduct a perception audit. Ask managers, engineers, operators, and inspectors to rate the organisation's quality performance across multiple dimensions. Then compare those perceptions to the actual data. Where perception significantly exceeds reality, you have located the halo. Where perception underestimates reality, you have a communication gap. Both are actionable, but the first is dangerous.
Quality does not care about narratives. It cares about whether the calibration was done on Tuesday, whether the operator read the work instruction, whether the CAPA addressed the root cause, and whether the incoming inspection sample size was sufficient. Every time you let one green metric wash over the red ones, you create the conditions for the failure that will eventually break through.