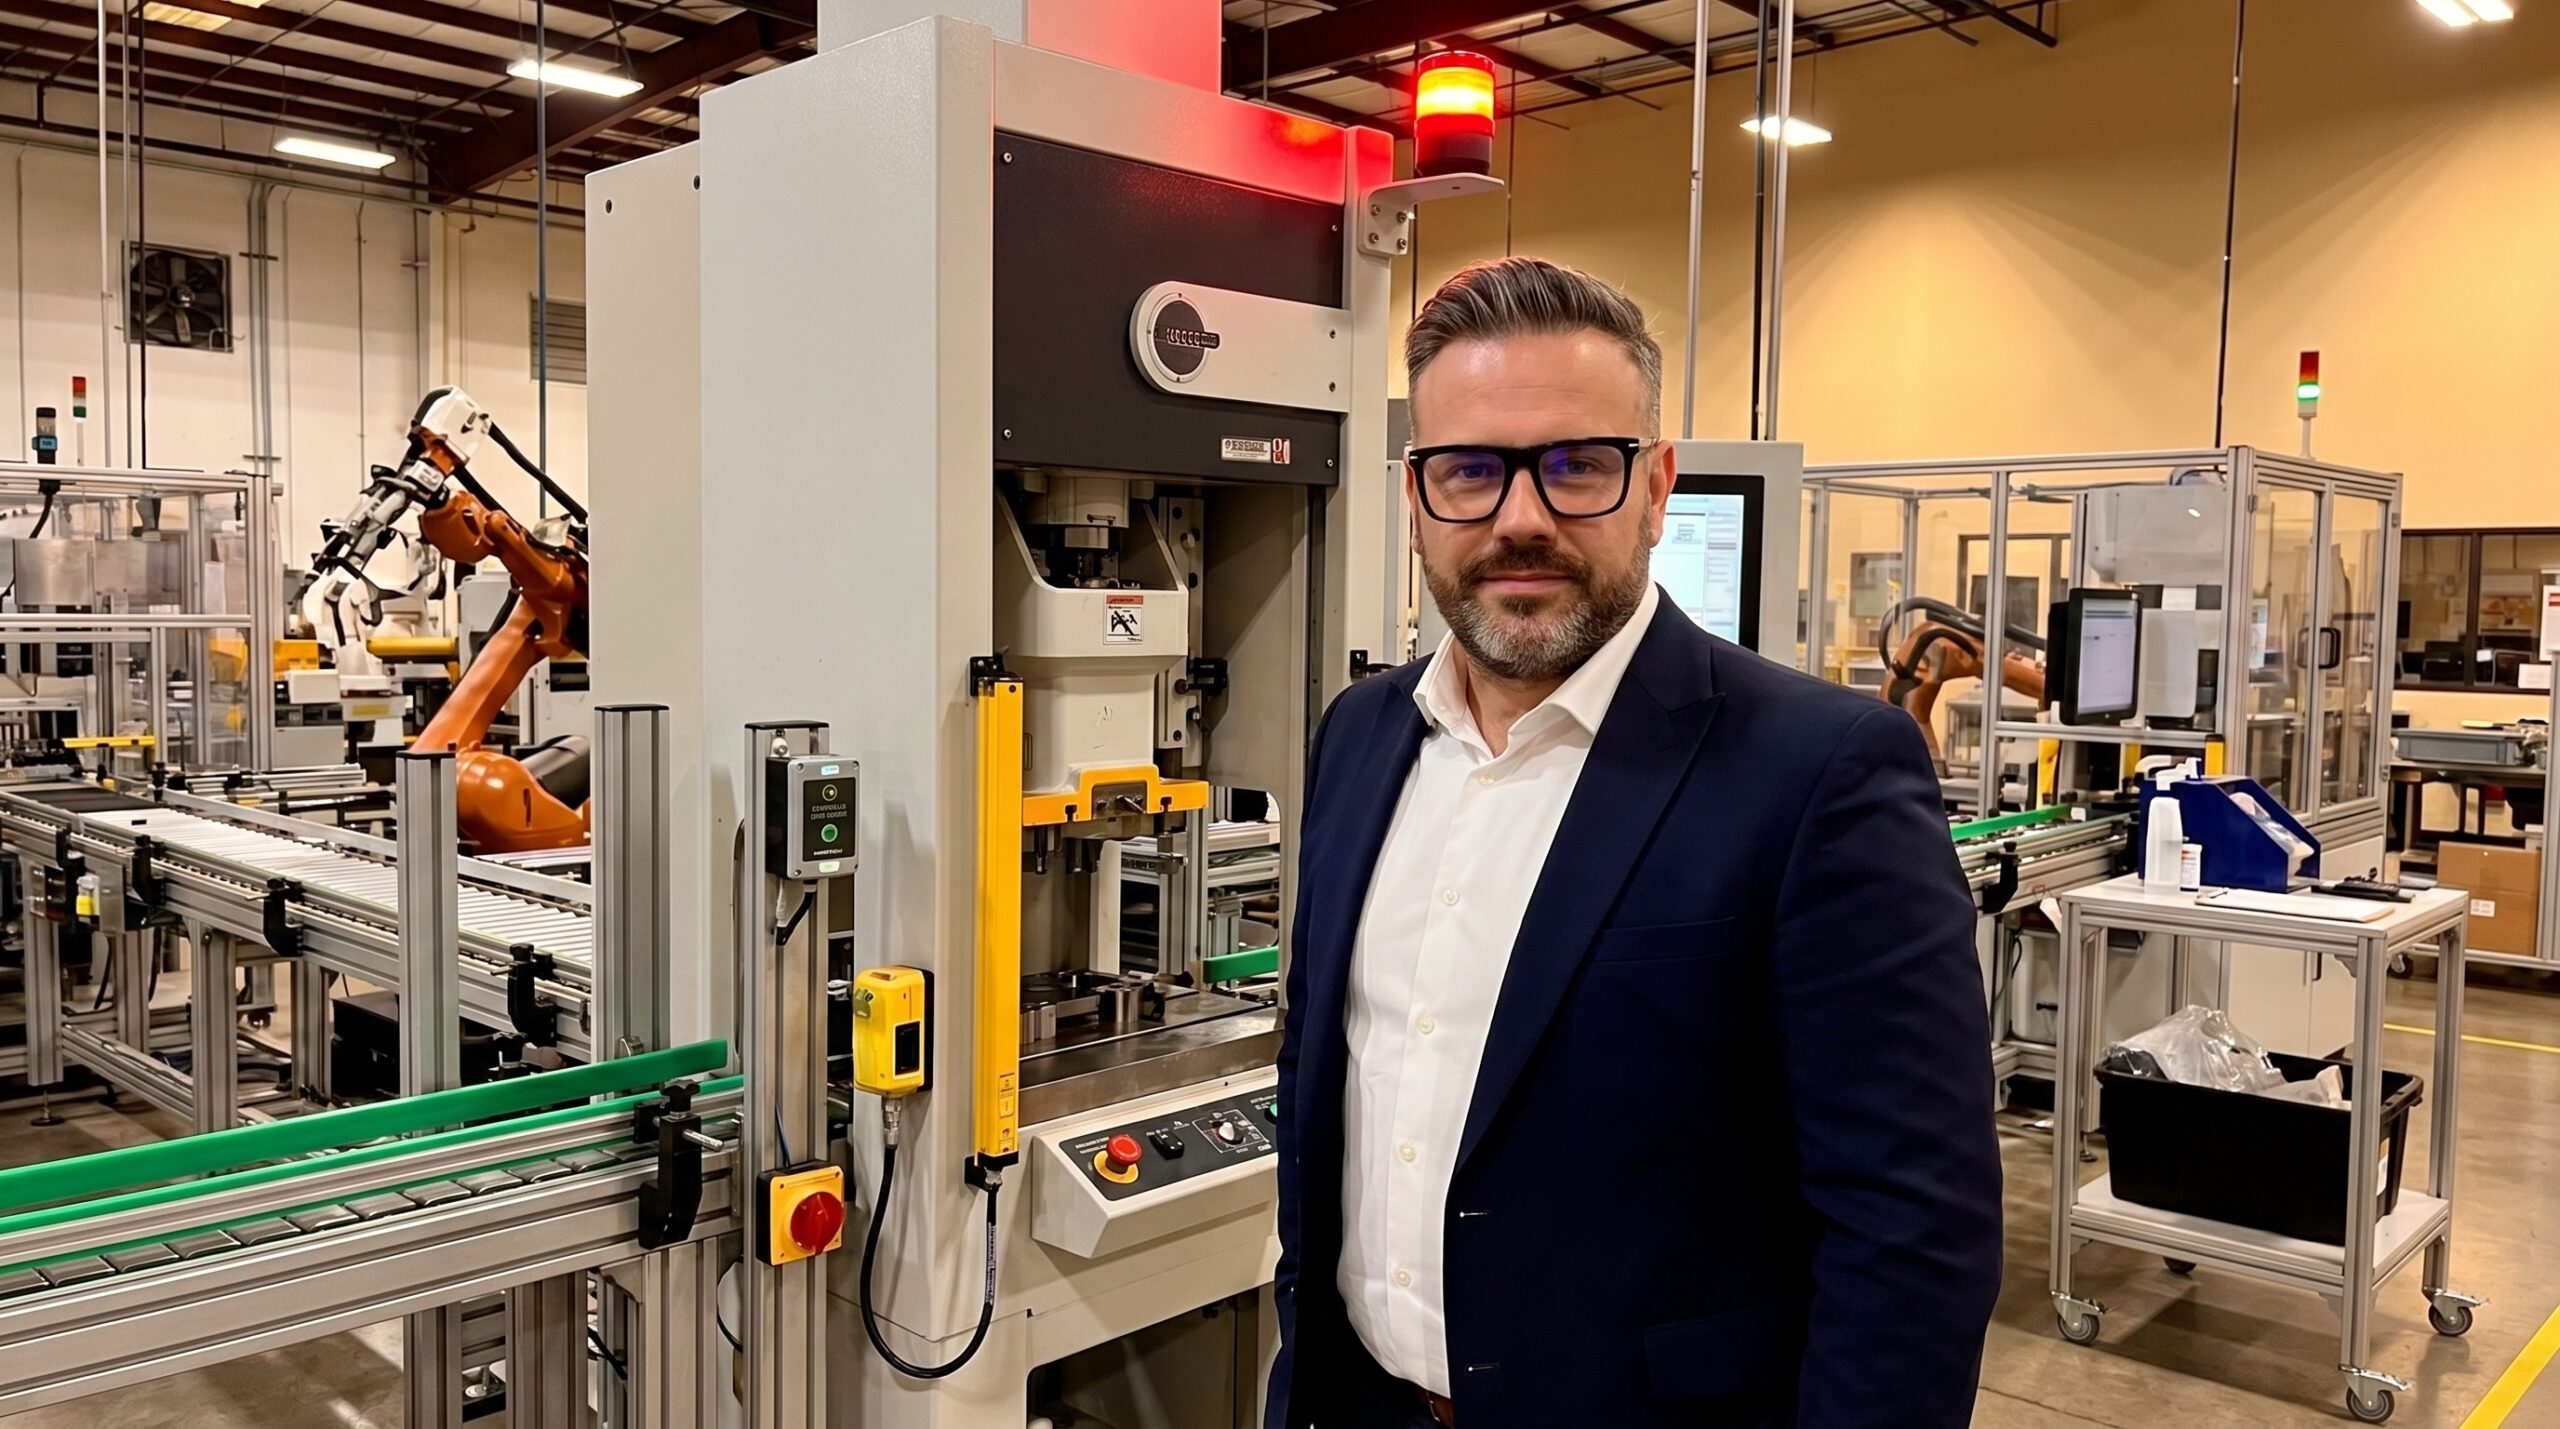
A stamping press running at 47 parts per minute shifts 0.3 mm out of alignment. No alarm sounds. The operator, monitoring three machines, sees nothing wrong because the line is still running. Twenty-eight minutes later, a downstream welding station catches the failure. By then, 1,386 defective panels are mixed across three containers heading toward assembly. The cost is four hours of lost production, delayed shipments, and weeks of engineering containment.
Now change one variable. When the feed mechanism misaligns, a positional sensor detects the deviation within two parts. The machine stops itself. An andon signal alerts the operator, who corrects the alignment and restarts in four minutes. Total defective parts produced: two. This difference—between 1,386 defects and two—is the operational gap that Jidoka closes.
Jidoka is one of the two pillars of the Toyota Production System alongside Just-In-Time. Yet while JIT dominates operational discussions through inventory reduction and flow, Jidoka does the foundational work. In Japanese, the term uses characters meaning "self" and "work" with a human touch—deliberately distinct from standard automation. Sakichi Toyoda invented the concept in the early 1900s with a loom that stopped instantly when a thread broke. The principle remains unchanged: stop before you produce the defect, not after.
The Four-Step Mechanism of Autonomation
Jidoka is not a sensor or a software module. It is a thinking system implemented through four sequential steps: detect, stop, fix, and investigate. The chain reaction only works when all four steps execute in order. Break the sequence—for instance, by detecting but not stopping—and the system collapses into standard post-hoc inspection. Each step requires specific engineering and cultural conditions to function.
Detection must happen at the source, in real time, automatically. This means building verification directly into the process rather than relying on downstream inspection. Sensors measuring force, position, or temperature are standard, but the mechanism need not be sophisticated. A mechanical pin that prevents a fixture from closing unless the part is correctly seated is pure Jidoka. The elegance is in the placement: detection occurs at the exact point where the failure mode originates.
Once detection triggers, the process stops immediately. Not after the current cycle finishes. Not when it is convenient. This is where manufacturing cultures built on OEE and uptime flinch. A process that produces defects while running is not productive—it is destructive. Every minute it continues after an abnormality generates scrap, rework, and customer risk. Toyota's andon cord applies this logic to human processes: the worker is the sensor, the cord is the stop, and the rule is absolute.
After the stop, the focus shifts to correction and investigation. The operator addresses the immediate cause—clearing a jam, realigning a feed—while the conditions are still observable. For complex failures, a team leader responds. The critical distinction from standard troubleshooting is the final step: every stop becomes a root cause analysis. Mature systems track why stops occur and implement countermeasures, causing stop frequencies to decrease over time as underlying problems are eliminated.

Three Levels of Implementation Maturity
Organisations implement Jidoka on a spectrum. Understanding where you sit on that spectrum determines your next engineering investment. The progression moves from isolated station protection to line-level synchronisation, and ultimately to systemic integration across the entire value stream.
The Three Tiers of Jidoka Integration
- System-LevelEngineering changes freeze affected lots; supplier data triggers incoming inspection escalations automatically.
- Line-LevelConnected stations: upstream stops feeding, downstream quarantines suspect material, and the MES logs the event.
- Machine-LevelIsolated error-proofing: torque tools, Poka-Yoke fixtures, and diverters protecting individual operations.
Most plants achieve machine-level Jidoka and stop. A torque tool that refuses to release a fastener outside specification, or a Poka-Yoke fixture that prevents backwards loading, catches defects at a single point. These are necessary but insufficient. They protect individual operations without addressing the systemic flow of quality through the value stream.
Line-level Jidoka connects these isolated points. When station seven detects an abnormality and stops, station six stops feeding to prevent overproduction, and station eight quarantines incoming material until quality is confirmed. The MES captures event parameters and flags the affected lot. This synchronised response prevents the propagation of defects down the line.
System-level Jidoka extends the principle beyond the shop floor. Engineering change processes automatically freeze production lots when a design deviation is discovered. Supplier quality systems trigger incoming inspection escalations when a vendor's Cpk data drifts. Corrective action systems cascade a customer 8D complaint into immediate containment across parallel processes. The principle permeates organisational decision-making.
Distinguishing Jidoka From SPC and Inspection
A frequent objection during implementation is that the plant already uses Statistical Process Control. SPC and Jidoka are complementary, but they operate on different timelines and serve fundamentally different functions within a quality system. Treating SPC as a substitute for autonomation leaves critical detection gaps.
| Attribute | Statistical Process Control (SPC) | Jidoka (Autonomation) |
|---|---|---|
| Trigger Mechanism | Data trends breach control limits after measurement | Physical sensors or logic detect instantaneous abnormality |
| Response Time | Retrospective; requires plot accumulation and review | Immediate; cycle halts within one or two parts |
| Primary Function | Monitor process stability and drift | Prevent defect propagation at the source |
| System Interaction | Generates reports and alerts for review | Physically locks out the process until cleared |
SPC tells you that your process is drifting after it has already drifted. You must plot enough points to see the trend, calculate the control limits, and initiate a reaction plan. It is a monitoring tool. Valuable, essential for capability studies, but retrospective by design. It requires human intervention to interpret the data and stop the line.
Jidoka stops the process the moment the abnormality occurs. There is no data accumulation phase, no trend analysis, no human interpretation required. A force sensor detects a missed stamping operation and locks the fixture. The defect is physically prevented from moving downstream. SPC is the weather report; Jidoka is the sprinkler system. A robust quality system requires both, but they are not interchangeable.
Overcoming the Cultural Resistance to Stopping
The primary barrier to Jidoka is cultural. In plants where operators are measured on parts produced per shift, stopping the line is treated as a failure. I have audited facilities where plant managers proudly reported 47 consecutive days without a stoppage, only to reveal a 3.2% defect rate on further questioning. That "perfect uptime" was generating thousands of defective parts per week.
The line that never stops is the line that is lying to you about its actual quality state.
When we installed detection logic at three critical stations in that facility, uptime dropped by 4%. The defect rate dropped by 72%. The net savings in the first quarter alone exceeded the engineering investment. The willingness to stop is not a sign of operational weakness; it is the signature of a mature quality system that prioritises getting it right over appearing to be right.
A related fear is that operators will trigger stops for trivial reasons. They will—at first. When Toyota introduced the andon cord in Georgetown, Kentucky, American workers pulled it hundreds of times per shift. The Japanese advisors welcomed this. Every pull revealed a hidden problem. Within months, the pulls decreased dramatically because the underlying process issues were systematically engineered out.
The fear of excessive stops is ultimately a fear of visibility. Jidoka makes invisible process failures visible. If your line runs without interruption, it does not mean you have zero problems. It means your detection mechanisms are blind to the failures occurring right now.
Building the Implementation Roadmap
Implementing Jidoka is a phased engineering project, not a weekend retrofit. The rollout must be structured to prove the concept on a small scale before connecting line-level systems. Attempting full integration without foundational station-level logic creates instability and erodes operator confidence in the stop protocols.
Sequential Rollout of Autonomation Logic
- 01Foundation (Months 1-6)Select three pilot stations. Conduct focused PFMEA. Install simplest detection methods. Define stop protocols and train operators on response logic.
- 02Expansion (Months 6-18)Prioritise remaining stations by Risk Priority Number. Connect individual Jidoka points into synchronised line-level stop logic. Develop standard work for troubleshooting.
- 03Maturity (Months 18-36)Integrate into engineering and supplier quality processes. Use data analytics to detect drift before physical triggers. Set targets for reducing total stop frequency.
The foundation phase is about proving the concept. Select three stations with known quality escapes and cooperative operators. Conduct a focused PFMEA to identify the top failure modes at each station. Implement the simplest possible detection mechanism—a mechanical pin, a limit switch, a weight-check—and establish clear rules for what happens when the mechanism triggers.
Expansion scales the logic from isolated stations to connected lines. Use the PFMEA data to rank all stations by Risk Priority Number. Build Jidoka on the highest-risk stations first, then begin linking them. When station seven stops, station six must stop feeding. Station eight must quarantine. Standard work documents the response protocol for each stop type, building institutional knowledge.
Maturity extends the principle beyond the shop floor and into predictive prevention. Data analytics identify early warning signs before physical sensors trigger. Engineering change processes automatically freeze affected lots. Management review processes escalate quality metric deterioration beyond defined thresholds. At this stage, Jidoka is no longer a line defence—it is an organisational reflex embedded in every system.
The Stop-to-Defect Ratio as a Leading Indicator
Most plants measure PPM, scrap percentage, and cost of poor quality. These are lagging indicators. They tell you what already escaped. Jidoka introduces a leading indicator that measures system health: the Stop-to-Defect Ratio. This metric compares the number of autonomous stops to the number of defects that actually reach the customer.
Tracking Jidoka System Health
A high ratio means the system catches problems before they become defects. A low ratio means problems are getting through the net. In early implementation, the ratio should be high: many stops, very few escapes. Over time, the ratio should evolve. As you solve the underlying problems triggering stops, both the stop frequency and the defect rate should decline together.
A declining stop-to-defect ratio combined with a declining defect rate is the signature of a maturing system. You are no longer simply catching more defects; you are preventing them at the source. The process has become intrinsically robust. The sensor remains in place as a safeguard, but the engineering countermeasures have made its activation rare.
As manufacturing systems integrate IoT sensors and machine learning, the detection capabilities supporting Jidoka expand. Algorithms can identify subtle process drift before physical sensors trigger. Digital twins can simulate failure modes and test detection strategies virtually. But the core engineering requirement remains unchanged: when something goes wrong, the process must stop immediately, and the root cause must be eliminated before restarting.