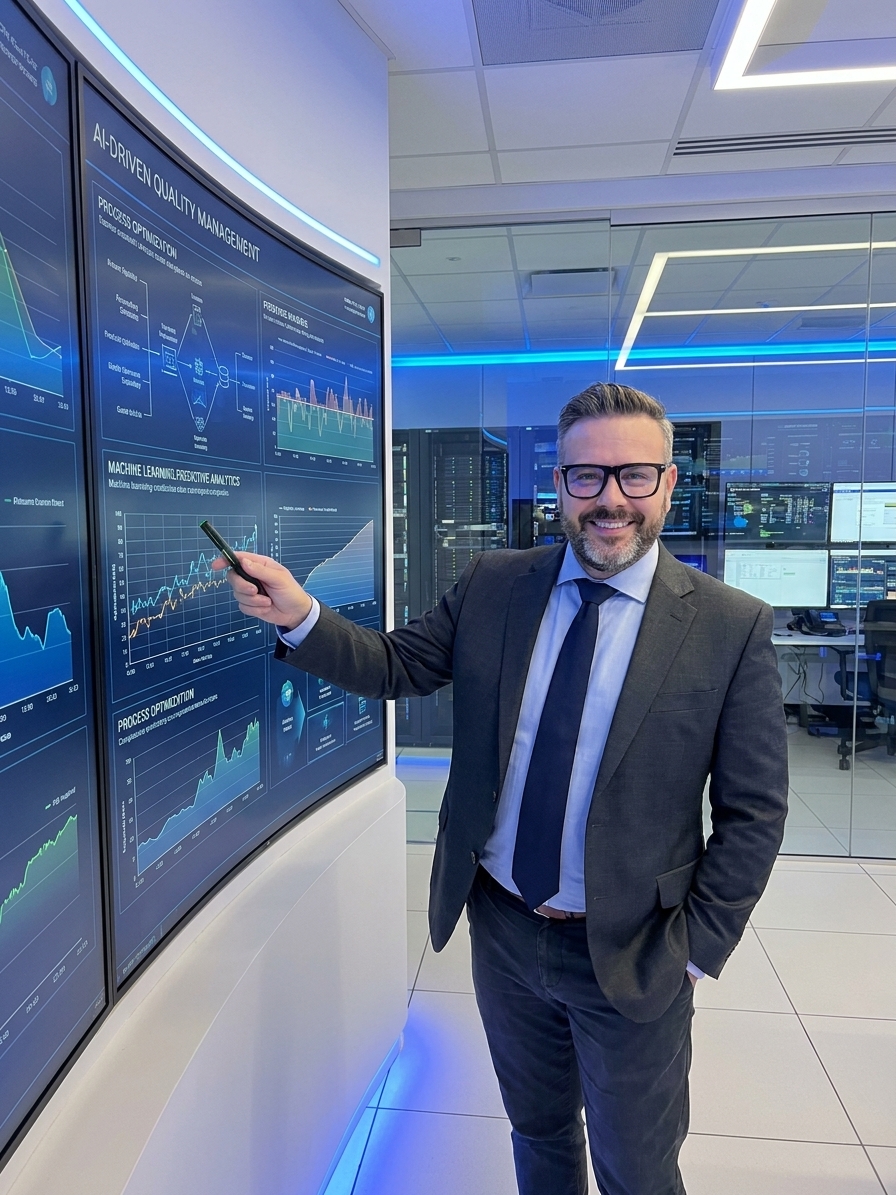
Predictive quality analytics promise to detect defects before they occur, but the gap between a pilot dashboard and a validated production system is where most initiatives fail. Over the past five years, I have supervised the implementation of AI and machine learning systems in quality across three distinct manufacturing environments: automotive interiors, pharmaceutical granulation, and electronics assembly. Each deployment followed the same arc of initial scepticism, data foundation work, model validation, and measurable financial return.
The technology is mature. Industrial cameras, edge computing hardware, and open-source model architectures are readily available. The barrier to entry is no longer cost or compute power. The barrier is data discipline, process stability, and the willingness of quality engineers to own the model outputs rather than treating ML as an IT deliverable.
What follows is a breakdown of three real deployments, the specific architectures used, and the failure modes I see repeatedly when organisations attempt to replicate these results without the necessary groundwork.
The Prerequisite: Process Stability Before Prediction
Machine learning applied to an unstable process produces fast nonsense. Before any model training begins, the target process must be brought under statistical control. If your control charts show unexplained special-cause variation, your ML model will learn to predict chaos. The first step is always stabilising the inputs: machine calibration, material lot consistency, environmental controls, and standardised operator work instructions.
I audited one automotive plant that attempted to deploy predictive maintenance on a press line without first addressing a 15 percent variation in raw material hardness. The model achieved impressive accuracy in testing, then collapsed in production because it had learned patterns specific to one material supplier. The fix was not a better algorithm. The fix was Supplier Development enforcing material specifications, followed by retraining the model on stabilised data.
Validate your measurement systems first. A Gauge R&R study confirming that your inspection variation is acceptable is non-negotiable. If your measurement system contributes more than 10 percent of total variation, any labels you assign for supervised learning are unreliable. The model will optimise against noise.
The sequence matters. Stabilise the process, validate the measurement, label historical data consistently, and only then begin model selection. Organisations that reverse this order spend heavily on cloud compute and consulting fees before discovering their foundation is sand.
Automotive Visual Inspection: CNN Deployment
At a large automotive supplier producing plastic interior panels, the baseline inspection operation relied on 12 human inspectors across three shifts. Detection rate sat at 85 percent, meaning 15 percent of defects reached the customer. Annual complaint costs were significant and inspector turnover was 40 percent per year. The business case for automated visual inspection was straightforward.
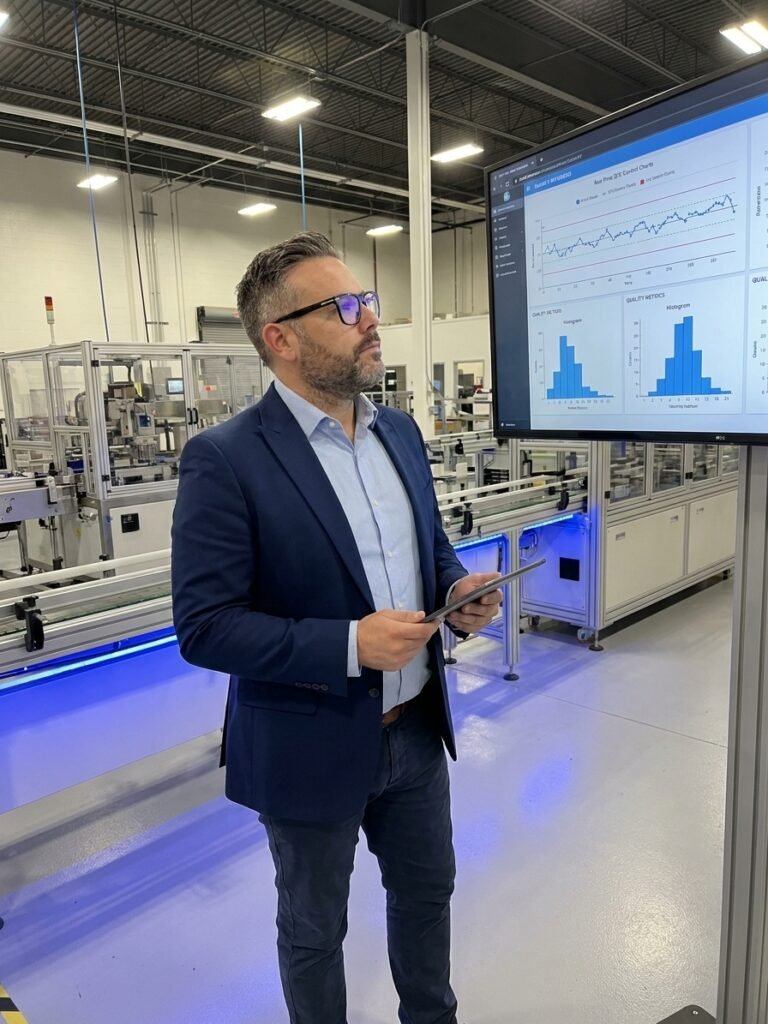
The deployment used a Convolutional Neural Network architecture. The data preparation phase consumed six weeks. An industrial 5-megapixel camera captured images at 60 frames per second under controlled LED ring lighting to eliminate shadow variance. We collected 50,000 images: 35,000 conforming and 15,000 defective. Experienced inspectors annotated every defect image by type, including scratches, mould flash, paint inconsistencies, and gate marks.
We used a ResNet-50 architecture, pre-trained on ImageNet, with transfer learning fine-tuned on the plant's own labelled data. Training ran for 50 epochs on cloud GPU infrastructure over eight hours. On the test set, the model achieved 97.8 percent overall accuracy, 96.2 percent recall for defect detection, and a false positive rate of 1.5 percent. Deployment used edge computing hardware directly at the line, delivering inference in under 50 milliseconds, with direct integration to the PLC for automatic rejection.
After twelve months in production, detection rate climbed to 97.8 percent. The inspection team reduced from 12 to 3 people, with displaced operators reassigned to upstream process control roles. Customer complaint costs dropped by roughly 88 percent. ROI was achieved in eleven months. The key lesson: the AI did not fix a broken process. It made a stable process far more efficient.
Pharmaceutical Process Prediction: Feature Engineering
In a pharmaceutical granulation process, batch-to-batch variability was running at plus or minus 15 percent against quality targets. Scrap rate was 8 percent, with 60 percent of that scrap attributable to granulation alone. Each batch carried roughly €45,000 in material cost. The annual scrap loss was substantial. The objective was a predictive model that could flag at-risk batches during the process, before drying and compaction.
Data integration was the most demanding phase. We aggregated 147 variables from granulator sensors, laboratory results, ERP batch records, and ambient humidity monitors. All data was timestamped and sampled every 30 seconds. The critical insight came from feature engineering: not all 147 variables mattered equally. Correlation analysis and domain expert input reduced the feature set to 23 variables. Crucially, we discovered that lagged features, meaning conditions from two to four hours prior, were more predictive than current readings. Interaction terms between temperature and humidity proved more significant than either variable alone.
We trained Random Forest and Gradient Boosting models on two years of historical batch data comprising 4,200 records, using five-fold cross-validation. The best-performing model was XGBoost, achieving an AUC of 0.94. In production, the model runs continuously. Operators see a predicted quality score updated every five minutes. If prediction confidence drops below 85 percent, the system recommends parameter adjustments within validated control limits.
Pharma Granulation: Key Model Validation Metrics
After eighteen months, scrap rate fell from 8 percent to 2.1 percent, a 74 percent reduction. Process variability tightened from plus or minus 15 percent to plus or minus 6 percent. The financial return was achieved in four months. The decisive factor was not the algorithm choice but the quality of feature engineering, driven by process engineers who understood why certain variables mattered.
Root Cause Analysis: NLP on Historical 8D Reports
At an electronics manufacturer producing over 150 8D reports annually, the average closure time was 23 days and the problem recurrence rate was 35 percent within six months. The core issue was institutional knowledge loss. When experienced engineers left, their understanding of recurring failure patterns left with them. The solution was applying Natural Language Processing to ten years of historical 8D documentation, comprising over 1,200 reports.
Text mining extracted failure descriptions, identified root causes, and mapped corrective actions. We built a knowledge graph linking problem types to verified causes and effective solutions. When an engineer opens a new 8D, the system surfaces the three most similar historical cases, the root causes confirmed in those cases, and the corrective actions that closed them. The system does not replace engineering judgement. It compresses the search time from hours of manual record review to seconds.
The impact was measurable. Average time to root cause identification dropped from 23 days to 6 days. Recurrence rate fell from 35 percent to 12 percent, because the system consistently surfaced corrective actions that had worked previously but had been forgotten. The knowledge graph now serves as a permanent, searchable institutional memory that does not degrade when staff turnover.
AI applied to an unstable process produces fast nonsense. Stabilise first, then predict.
The broader application for quality leaders is clear. Every organisation with a mature 8D or CAPA system is sitting on a decade of structured problem-solving data. That data is rarely mined systematically. NLP turns a document archive into a queryable engineering tool.
Implementation Requirements and Common Failure Modes
The most common failure mode is investing in AI infrastructure before addressing data quality. Teams allocate budget to cloud platforms and data science talent, then discover that their historical data is inconsistently labelled, missing timestamps, or measured with uncalibrated instruments. The rule I enforce: spend 70 percent of project time on data preparation, cleaning, and validation. Spend 30 percent on the model. Teams that invert this ratio deliver impressive demos that fail in production within weeks.
The second failure mode is model overcomplexity. Many organisations default to deep learning when a logistic regression or random forest would achieve the same result with far greater interpretability. In regulated environments, model explainability is not optional. A black-box model that cannot explain its predictions to an auditor is a liability. Use interpretable models where possible, and apply techniques like SHAP values to explain complex model decisions.
How AI Deployments Succeed Versus How They Fail
What fails
- IT-led deployment with no quality engineer ownership
- Deep learning chosen by default, ignoring interpretable alternatives
- Data labelled by junior staff without process knowledge
- Model deployed without monitoring for concept drift
What works
- QA-led deployment with data engineering support
- Simplest model that meets the accuracy requirement
- Labels validated by experienced process inspectors
- Monthly retraining triggers and performance dashboards
The third failure is neglecting model maintenance. A predictive model is not a static deliverable. Process conditions drift over time, material suppliers change, and equipment wears. Without monitoring for model drift and scheduling regular retraining cycles, accuracy degrades silently. I have seen models that performed at 97 percent in January drop to 78 percent by July because no one monitored whether the production data distribution still matched the training data.
The fourth failure is deploying without domain expertise. A data scientist who does not understand why process temperature interacts with humidity will build a model that misses the most predictive features. The successful deployments I have led all paired a data scientist with a quality engineer who had deep process knowledge. The quality engineer defined the features worth investigating. The data scientist handled the architecture. Neither role could succeed alone.
Minimum Viable Data and Scalability
Before beginning any AI initiative, confirm you have the minimum viable data. For classification tasks, this means at least 1,000 labelled examples, though 5,000 or more is preferable for robust generalisation. For process prediction, you need six to twelve months of historical data with consistent measurement methods. If your measurement system or inspection criteria changed mid-stream, the data from before that change is not comparable and will corrupt the training set.
Budget realistically. A cloud-based pilot using existing data can run between €5,000 and €15,000. An edge computing deployment with industrial sensors and cameras typically requires €50,000 to €150,000. A full-scale AI platform with custom development and validated integration into controlled production systems will cost €200,000 to €500,000. These ranges are starting points. The financial case must be built on quantified defect costs, scrap rates, and complaint expenses, not on speculative future benefits.
Start with a single use case that has clear financial impact, measurable baseline data, and a motivated process owner. Prove the return on investment over six to twelve months. Document the methodology, the data architecture, and the validation results. Only then scale to a second application. Organisations that attempt three simultaneous pilots typically deliver none of them to production, because the quality engineering bandwidth required to support each deployment exceeds what is available.
AI in quality engineering is not future technology. It is present capability. The organisations gaining competitive advantage are those that deploy it with engineering rigour, not those waiting for the technology to become easier. The technology is already accessible. The discipline required to deploy it correctly is not, and that is where the advantage resides.