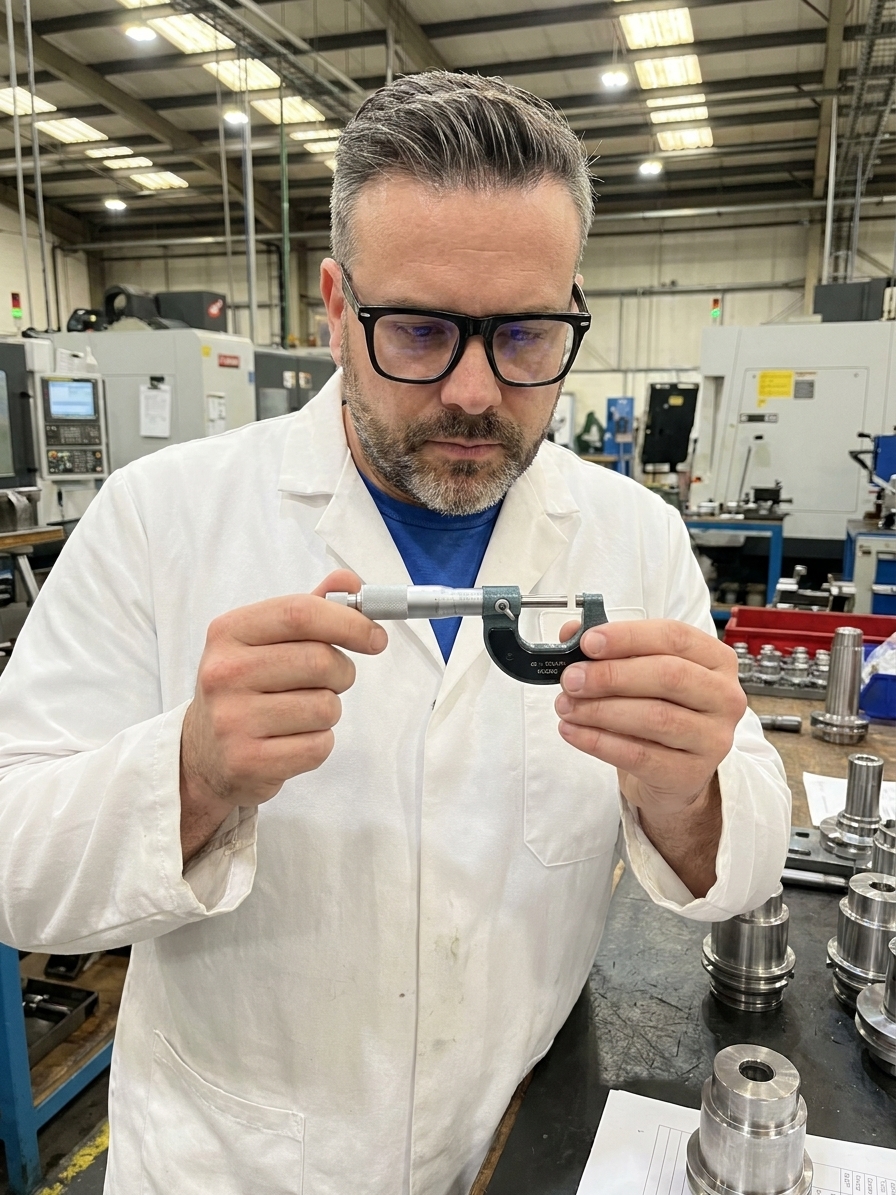
Every day, operators across your plant capture dimensions, weights, and surface finishes. Those numbers flow directly into your SPC charts, your Cpk calculations, and your final acceptance decisions. You base scrap rates, process adjustments, and customer shipment approvals entirely on this data.
But very few manufacturers ever ask the fundamental question: is the measurement system actually capable of telling the truth? In my 20 years of auditing quality systems at companies like a major aerospace manufacturer and SNOP, I consistently find unvalidated measurement systems producing unreliable data. The gages lack resolution, the fixtures introduce variation, and nobody knows — because nobody ever checked.
This is the reality of ignoring Measurement System Analysis (MSA). Every measured value is a combination of true part variation and measurement error. If the measurement system variation is large relative to part variation, your data is mostly noise. You end up adjusting a stable process based on measurement error, scrapping good parts, and shipping bad ones.
The Mechanics of Measurement Error
MSA is a structured methodology for evaluating whether your measurement system produces trustworthy data. The system includes the gage, the operator, the method, and the environment. Mathematically, observed variation equals true part variation plus measurement system variation.
When measurement system variation dominates, you make decisions based on static. You tweak offsets, change tooling, and slow down cycle times to chase phantom process shifts. The process is actually stable, but the noise from the measurement system creates an illusion of instability that drives operators to overcorrect real variation.
MSA gives you the statistical tools to quantify this noise. It puts a hard number on how much of your observed variation is real and how much is the measurement system distorting reality. Without this baseline, every subsequent quality decision is a gamble.
Gage R&R: Separating Signal From Noise
The most common MSA tool is the Gage Repeatability and Reproducibility (Gage R&R) study. You select parts that represent the expected process range, select operators who normally run the measurement, and have each operator measure each part multiple times.
You then decompose the observed variation into components. Repeatability evaluates whether the same operator using the same gage gets the same result repeatedly. Reproducibility evaluates whether different operators measuring the same parts agree. Part-to-part variation is the actual signal you are trying to measure.

The results expose the reliability of your data. I frequently audit plants running Gage R&R studies that come back at 40%, 50%, or higher. The study gets filed in a quality manual, and the factory keeps using the same unvalidated gage, producing the same unreliable data day after day.
Gage R&R Acceptance Thresholds
The Financial Impact of Unvalidated Data
Bad measurement data destroys manufacturing operations through false rejects. When your gage reads high or low due to error, you scrap parts that are actually within specification. At WITTE Automotive, I have seen how a simple CMM fixtoring issue can inflate scrap rates dramatically, generating pure waste that management accepts as normal process variation.
The reverse is far more dangerous. A false accept ships defective product to your customer. In IATF 16949 and AS9100 environments, this triggers 8D investigations, customer portals, and potentially halted shipments. The cost of a single field escape routinely exceeds the cost of an entire MSA program by orders of magnitude.
Unvalidated data also corrupts your process capability metrics. If your measurement system contributes heavily to observed variation, your Cpk of 1.33 might mask a true process capability of 1.55. You will waste engineering hours trying to optimize a process that is already capable while a defective gage drags the numbers down.
Root cause analysis fails when the underlying data is unreliable. You change tooling when the gage was the problem. You replace machines when the fixture was the problem. Without MSA, your 8D teams will spend thousands of euros solving the wrong variables.
The Five Characteristics of a Complete MSA
A complete MSA evaluates five distinct characteristics. Most companies stop at repeatability and reproducibility. Many never even get that far. But to truly trust your data, you must evaluate bias, linearity, and stability as well.
Bias is the difference between the observed average measurement and a master reference value. If your gage consistently reads high, that systematic error shifts all your data in one direction. You can compensate for bias with calibration, but only if you actively measure it.
Linearity asks whether the bias changes across the measurement range. A gage might be accurate at 25 mm but read high at 50 mm. If you only calibrate at one point, you will never catch this drift. Stability verifies that the system does not drift over time due to thermal expansion, wear, or electronic fatigue.
| Characteristic | What It Measures | Typical Failure Mode |
|---|---|---|
| Bias | Difference between measurement average and reference value | Systematic shift in one direction |
| Linearity | Change in bias across the measurement range | Accuracy degrades at upper or lower limits |
| Stability | Drift over time under normal conditions | Thermal expansion or electronic drift |
| Repeatability | Variation from the same operator on the same part | Gage wear, poor resolution, fixture looseness |
| Reproducibility | Variation between different operators | Inadequate training, subjective technique |
Implementing an MSA Framework on the Floor
Implementing MSA requires prioritizing by risk. Not every dimension needs a formal Gage R&R. Start with the characteristics on your control plans — the dimensions tied to customer specifications, safety requirements, and regulatory compliance. List the characteristic, the gage used, the operator, and the method.
Customer-facing dimensions with tight tolerances go first. Safety-critical measurements go first. Measurements driving your SPC charts go first. Use a standard cross-tabulated approach with up to ten parts, multiple operators, and repeated trials. Calculate the results against both total variation and tolerance.
MSA Implementation and Corrective Action Cycle
- 01Inventory Critical MeasurementsIdentify dimensions on control plans tied to customer or safety specs.
- 02Conduct Gage R&R StudyRun cross-tabulated studies using representative parts and standard operators.
- 03Analyse VariationBreak down repeatability, reproducibility, and part-to-part variation.
- 04Execute Corrective ActionsRepair gages, redesign fixtures, or standardise operator methods.
- 05Schedule Recurring AuditsRe-run studies annually or whenever gages, operators, or methods change.
Acting on the results is where most manufacturers fail. High repeatability error points to an equipment issue — you must replace or repair the gage, improve fixturing, or increase gage resolution. High reproducibility error points to an operator issue — you must standardize the method, implement visual work instructions, and use go/no-go fixtures to eliminate subjectivity.
Measurement systems degrade. Gages wear, operators change, and methods drift. Make MSA a recurring requirement, not a one-time PPAP hurdle. Run studies annually at minimum, or immediately whenever you change gages, operators, methods, or environments.
Attribute Data and the Visual Inspection Trap
Variable measurements are only half the picture. In most plants, the most common inspection method is visual: operators judging weld quality, surface defects, and assembly completeness. These attribute measurement systems need validation just as desperately as your CMMs and calipers.
The tool for this is the Attribute Agreement Analysis. You give multiple operators the same set of parts — some known good, some known bad, some borderline — and have them classify each one. You then measure within-operator agreement, between-operator agreement, and agreement with the known standard.
If your gage error consumes half the tolerance band, your SPC chart is tracking measurement noise, not process variation.
I have run attribute studies where different operators agreed with each other less than 60% of the time. Agreement with the known standard was essentially a coin flip. These operators were making pass/fail decisions on products going to customers every single day, completely unsupported by validated standards.
The fix for attribute error is usually better visual standards: boundary samples, annotated photographs, and physical reference specimens with clear defect definitions. But you will never know you need these fixes until you measure the measurement system itself. MSA is not overhead — it is the foundational intelligence that prevents you from making expensive decisions based on faulty data.