You know the scenario. The customer demands a Gage R&R study.
Your quality engineer fires up Minitab, collects ten parts, three
operators, three trials each, and produces a beautiful report with a
nice bar chart showing “% Study Variation” in green. The number comes in
under 10%. Everyone cheers. The report gets filed in the quality manual.
And nobody — not one single person in your organization — ever asks
whether the measurement system actually produces trustworthy data on the
shop floor on a Tuesday afternoon when the inspector is tired, the
temperature shifted, and the part came from a different supplier
lot.
This is the story of Measurement Systems Analysis. Not the textbook
version with its neat formulas and acceptance thresholds. The real
version — the one where a powerful statistical tool gets reduced to a
compliance artifact, where the study you ran in a controlled environment
became the proof you relied on for a process you never actually
validated, and where the measurements you collected with such care
became the data you could never defend when a customer dispute
arrived.
The Foundation Nobody
Questions
Measurement Systems Analysis exists for a deceptively simple reason:
before you can control a process, you need to know that your
measurements are telling you the truth. It sounds obvious. If your scale
reads 42.3 grams, is the part actually 42.3 grams? If your micrometer
says the bore is 25.012 mm, can you trust that number to the third
decimal place?
The answer, in most manufacturing operations, is: nobody actually
knows. And the Gage R&R study that was supposed to answer that
question has become a document stored in a digital folder that auditors
check and operators never see.
Here is what MSA actually measures. Every measurement you take
contains variation from two sources: the variation in the parts
themselves (which is what you want to understand) and the variation
introduced by the measurement process (which is noise that corrupts your
data). The measurement variation breaks down further into repeatability
— can the same operator get the same answer twice? — and reproducibility
— can different operators get the same answer on the same part? A proper
MSA quantifies these components and tells you, in no uncertain terms,
whether your measurement system is adequate for the decisions you are
making based on its data.
The problem is not that the tool is flawed. The tool is
extraordinarily powerful. The problem is that organizations have
systematically stripped MSA of its meaning while preserving its
form.
The
Five Ways You Are Destroying Your Measurement Studies
1. The Hand-Picked Parts
Problem
The standard requires that you select parts that represent the full
operating range of the process. In practice, what happens? Your
inspector walks over to the production line, grabs ten consecutive
parts, and runs the study. Those ten parts represent about thirty
seconds of production. They capture none of the between-lot variation,
none of the tool-wear drift, none of the material variation from
different suppliers.
The result? Your Gage R&R percentage looks fantastic — because
the part-to-part variation in your sample is artificially low, which
inflates the denominator of the equation, which shrinks the apparent
contribution of the measurement system. You have not proven your
measurement system is good. You have proven that you do not understand
the math behind your own quality report.
The fix is not complicated but it requires discipline: select parts
deliberately across the expected range, including some near the
specification limits. If your process rarely produces parts near the
limits, create them deliberately — this is not “cheating,” it is what
the standard actually requires. You need parts that span the operating
range, not parts that are convenient to collect.
2. The
Controlled-Environment Illusion
Your Gage R&R study was performed in the quality lab. The
temperature was 20°C. The lighting was ideal. The parts were clean. The
operators knew they were being watched. They took their time. They were
careful.
Now walk out to the shop floor. The temperature swings from 15°C to
35°C depending on the season. The lighting is inconsistent. Parts arrive
with cutting fluid residue. The inspector is measuring 200 parts per
shift under time pressure while also filling out three other forms.
Your study measured the measurement system under conditions that bear
no resemblance to the conditions under which it actually operates. This
is not a minor methodological quibble. It is the single biggest reason
that Gage R&R studies fail to predict real-world measurement
performance.
The fix: run the study on the shop floor, during a normal production
shift, using the actual inspection environment. If the results are worse
— good. Now you know the truth. A comforting lie in a quality report is
more dangerous than an uncomfortable truth on a clipboard.
3. The Operator Training
Amnesia
Reproducibility — the ability of different operators to get
consistent results — is where most measurement systems fail. And it
fails because organizations treat operator training as a one-time event
rather than an ongoing discipline.
You certified Operator A on the CMM in 2023. Operator B was certified
in 2024. They were trained by different people using different
procedures. Operator A measures the bore diameter by sweeping the probe
in a circular path. Operator B measures it by taking three discrete
points and calculating the best-fit circle. Both believe they are
following the procedure. Both produce systematically different
results.
The Gage R&R captures this discrepancy — for one moment in time.
Then the study is filed away, operators drift further apart in
technique, new people are trained with even less rigor, and within six
months the reproducibility numbers in your study bear no relationship to
reality.
The fix: MSA is not a one-time event. It is a periodic discipline.
Re-run studies when operators change, when methods change, when
equipment is serviced, and at a defined regular interval regardless. If
that sounds expensive, calculate the cost of a customer rejection based
on measurement data you could not defend.
4. The Resolution Mismatch
Here is a scenario that plays out in manufacturing plants worldwide.
You have a tolerance band of ±0.05 mm on a critical dimension. Your
digital caliper reads to 0.01 mm. Someone runs a Gage R&R and gets
acceptable numbers.
The measurement system can only resolve in 0.01 mm increments. Your
tolerance band is 0.10 mm wide. You have ten discrete measurement
intervals across the tolerance. The generally accepted rule is that your
measurement resolution should be at least one-tenth of the tolerance
band — which means you need 0.005 mm resolution, not 0.01 mm.
But nobody checks this before the study. The study runs, produces
numbers that look acceptable because the resolution limit artificially
truncates the variation, and the report is filed. You have just
certified a measurement system that is fundamentally incapable of
detecting the variation you need it to detect.
This is called the “discrimination” or “resolution” problem, and it
is the most under-diagnosed failure mode in measurement systems
analysis. Not because it is hard to detect — it is actually trivially
obvious if you look at the data — but because nobody looks at the data.
They look at the summary number at the bottom of the Minitab report.
5. The Attribute Gauge
Catastrophe
All of the above applies to variable measurements — dimensions,
weights, forces. But a significant portion of your inspection is likely
attribute-based: go/no-go gauges, visual inspection, pass/fail criteria.
And for attribute measurement systems, the situation is far worse.
Organizations routinely run visual inspection operations with no MSA
whatsoever. An inspector looks at a part and decides whether the surface
finish is acceptable. Another inspector looks at the same part and makes
a different decision. The “measurement system” for visual inspection is,
in many factories, a person who was shown three examples on their first
day and told “use your judgment.”
Attribute agreement analysis exists precisely for this purpose. It
quantifies how often inspectors agree with themselves (repeatability),
with each other (reproducibility), and with a known standard (accuracy).
The results are almost always shocking. Typical visual inspection
agreement rates hover around 60-70% — which means your visual inspection
process is essentially a coin flip with extra steps.
The fix is uncomfortable because it exposes how unreliable human
inspection actually is. But the alternative — continuing to pretend that
your visual inspection is catching defects when it is actually missing
30% of them — is far more uncomfortable when the customer finds them
first.
The Bias Nobody Talks About
There is a deeper issue with measurement systems that most MSA
training never addresses: bias. Not statistical bias in the mathematical
sense, but the systematic distortion that occurs when measurement
systems are influenced by factors that have nothing to do with the part
being measured.
Temperature affects dimensional measurements. Humidity affects
electronic gauges. Vibration affects sensitive instruments. Operator
fatigue affects everything. Most Gage R&R studies are snap shots — a
moment in time, one set of conditions. They do not capture the
systematic biases that creep in as conditions change over days, weeks,
and seasons.
A proper measurement systems analysis includes bias studies and
stability studies — not just Gage R&R. Bias tells you whether your
measurement system is centered correctly. Stability tells you whether it
stays centered over time. Linearity tells you whether the bias changes
across the measurement range.
These studies are not exotic. They are described in the AIAG
Measurement Systems Analysis reference manual, which is the foundational
text that every automotive quality professional claims to have read and
almost none have actually implemented in full.
The Real Cost of
Measurement Uncertainty
Let us talk about money, because that is the language that actually
drives change in manufacturing organizations.
Every measurement you take has uncertainty. When that uncertainty is
large relative to your tolerance band, bad things happen. You ship parts
that are actually out of tolerance because your measurement system read
them as good — this is called “consumer’s risk” or Type II error. You
scrap parts that are actually good because your measurement system read
them as bad — this is called “producer’s risk” or Type I error.
Both are expensive. Producer’s risk is visible — it shows up as high
scrap rates. Consumer’s risk is invisible until it isn’t — it shows up
as a customer rejection, a field failure, a warranty claim, or a
recall.
The cost of a proper measurement systems analysis program is trivial
compared to the cost of decisions made on bad data. A Gage R&R study
for a single instrument might cost a few hours of engineering time and
some production downtime. A single customer rejection traced to an
inadequate measurement system can cost hundreds of thousands of dollars
in sorting, containment, root cause analysis, corrective action reports,
and lost business.
Yet organizations will invest in production equipment, automation,
and IT systems while treating measurement systems analysis as a clerical
function performed grudgingly to satisfy a PPAP requirement.
The Path Back to Meaning
Measurement Systems Analysis is not a document. It is not a report
you produce for an audit. It is a discipline — a continuous, honest
assessment of whether the numbers driving your decisions deserve the
authority you have given them.
The path back to meaning requires three commitments.
First, run studies that reflect reality. Shop floor conditions. Real
operators. Representative parts. Full operating range. If the numbers
are bad, that is the most valuable information you have ever received
about your process. Act on it.
Second, make MSA a recurring discipline, not a one-time event.
Measurement systems drift. Operators change. Equipment wears. If your
last Gage R&R is more than twelve months old, or if anything about
the measurement process has changed since it was run, your study is
historical fiction.
Third, extend MSA beyond variable gauges. Your visual inspection,
your attribute gauges, your automated vision systems — all of these are
measurement systems that need validation. The attribute agreement
analysis you have never run on your visual inspection process is almost
certainly hiding a defect rate that would keep you awake at night.
The measurements you trust are only as good as the analysis that
validates them. And the analysis that validates them is only as good as
the honesty you bring to designing it.
Stop filing studies. Start understanding measurement.
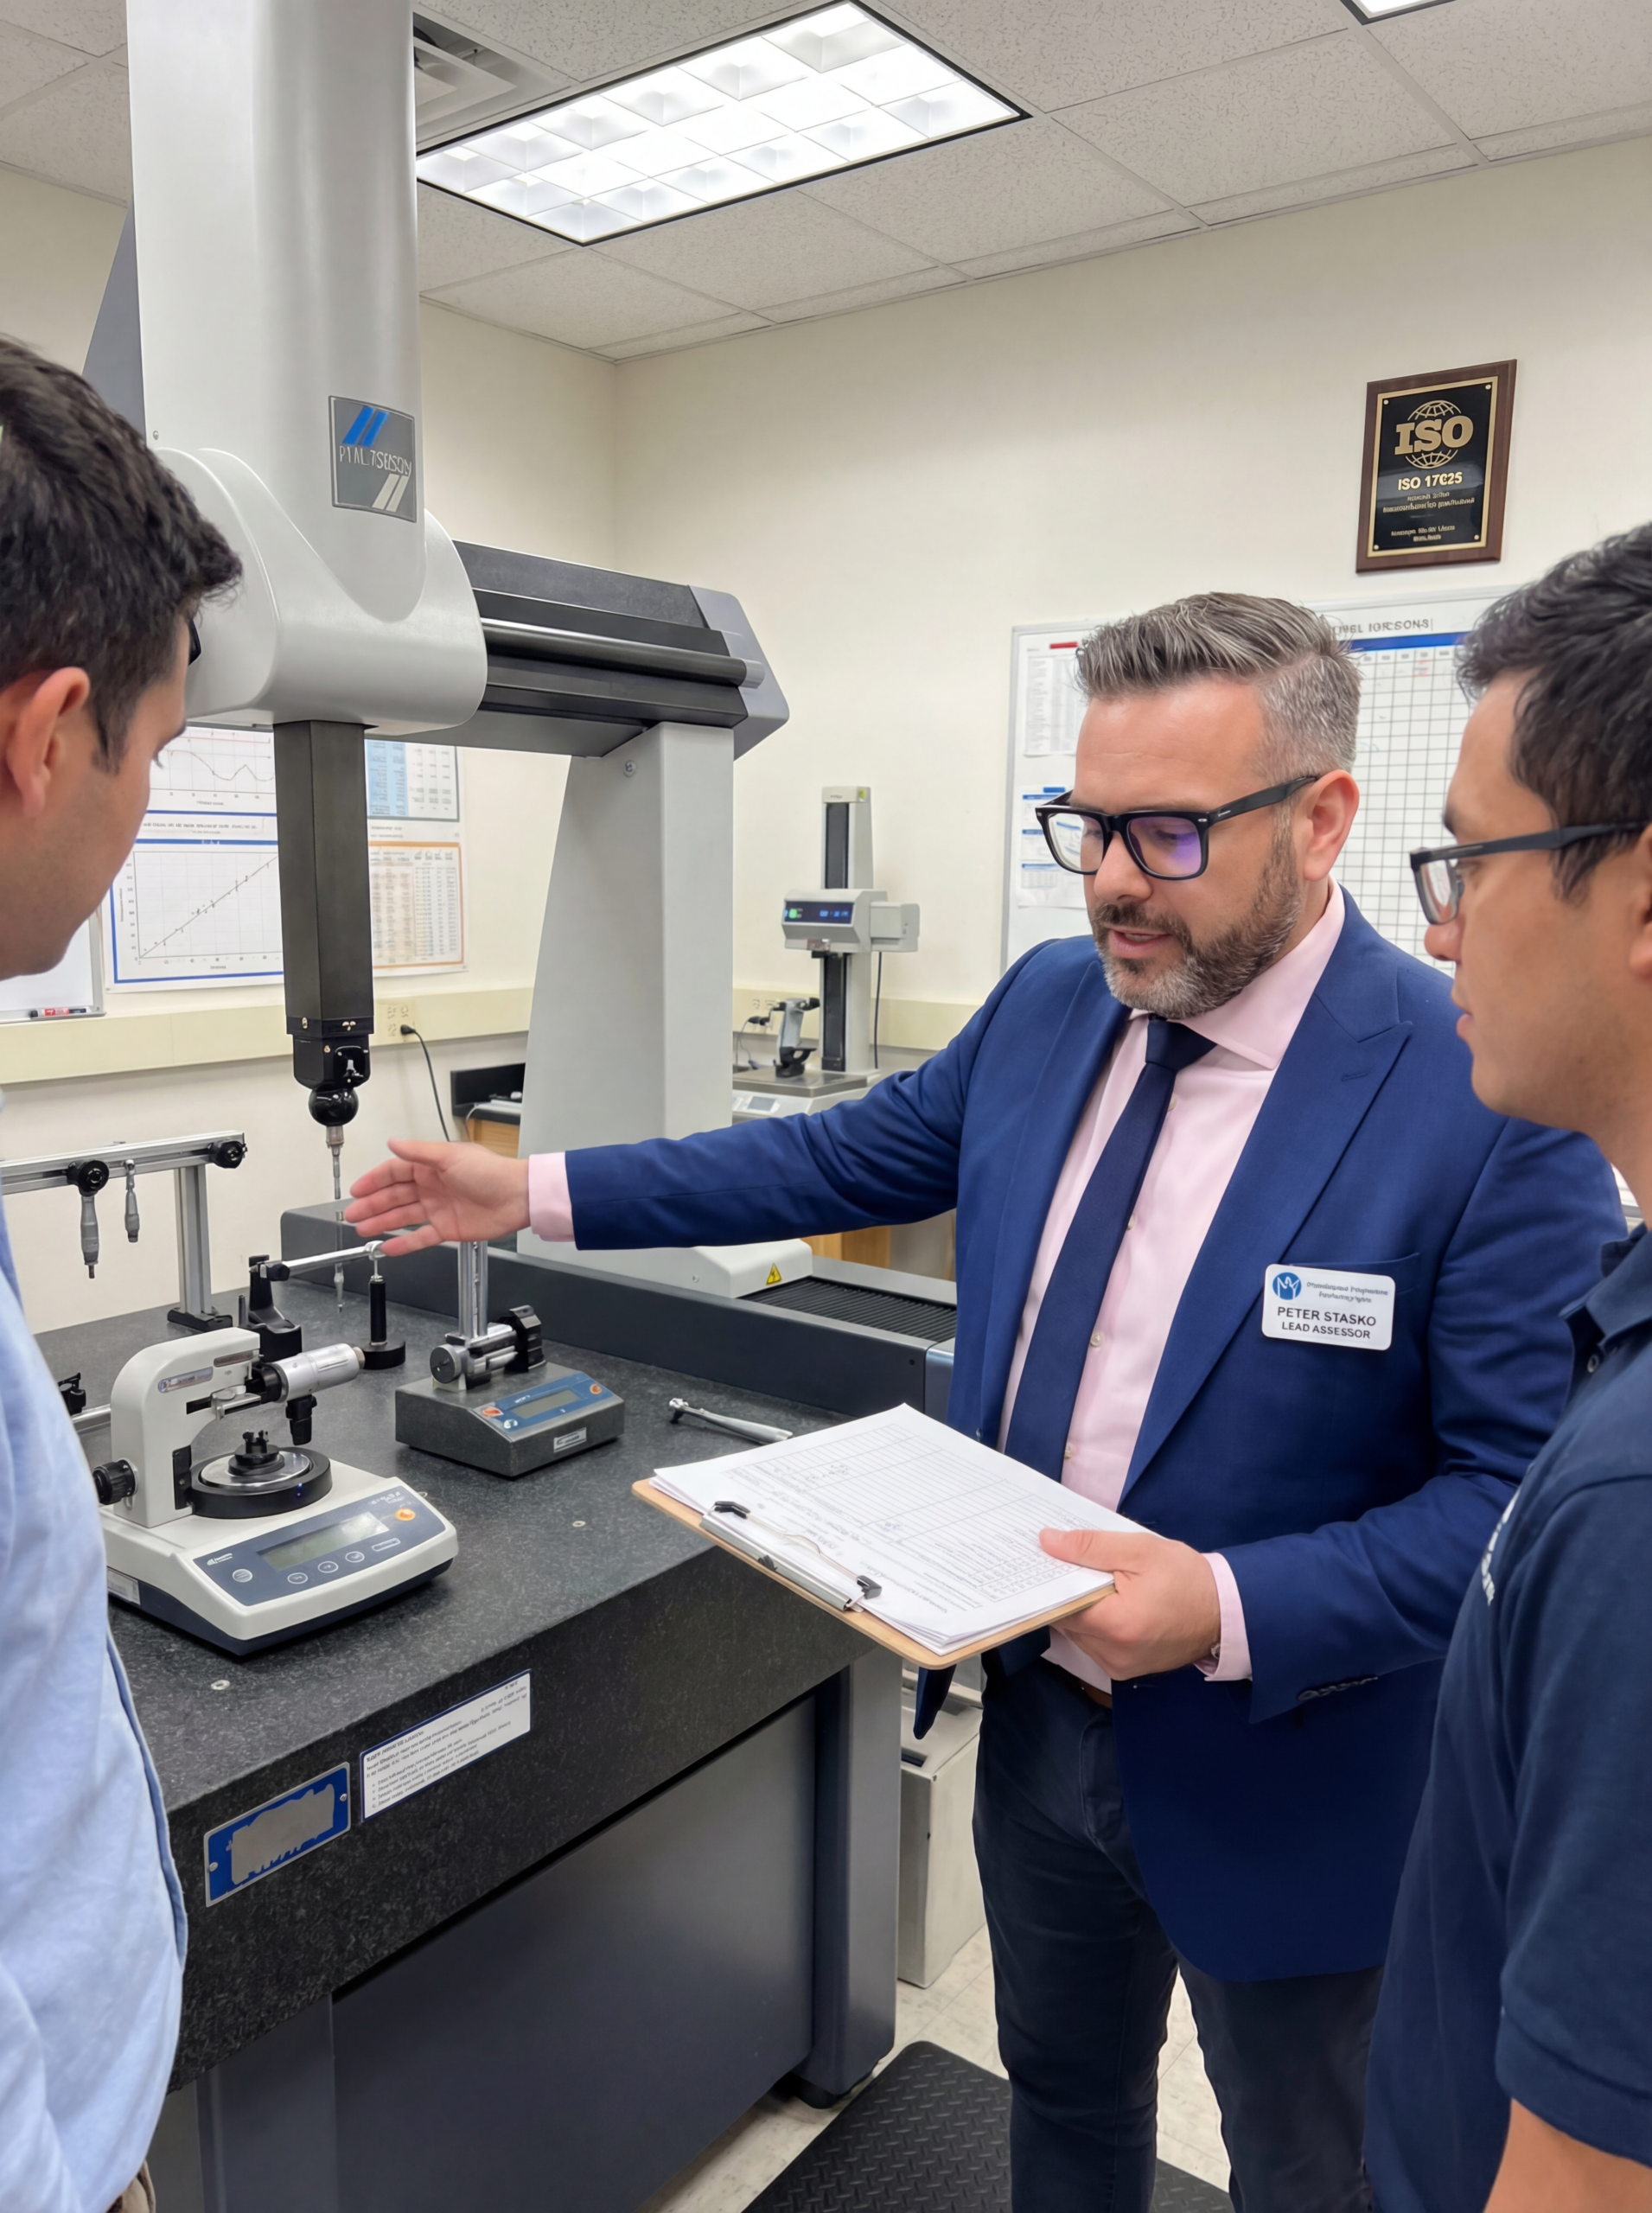
About the Author: Peter Stasko is a Quality
Architect with over 25 years of experience transforming manufacturing
quality systems across automotive, electronics, and industrial sectors.
He specializes in taking statistical tools that organizations have
reduced to paperwork and restoring them to their original purpose:
driving better decisions through better data.