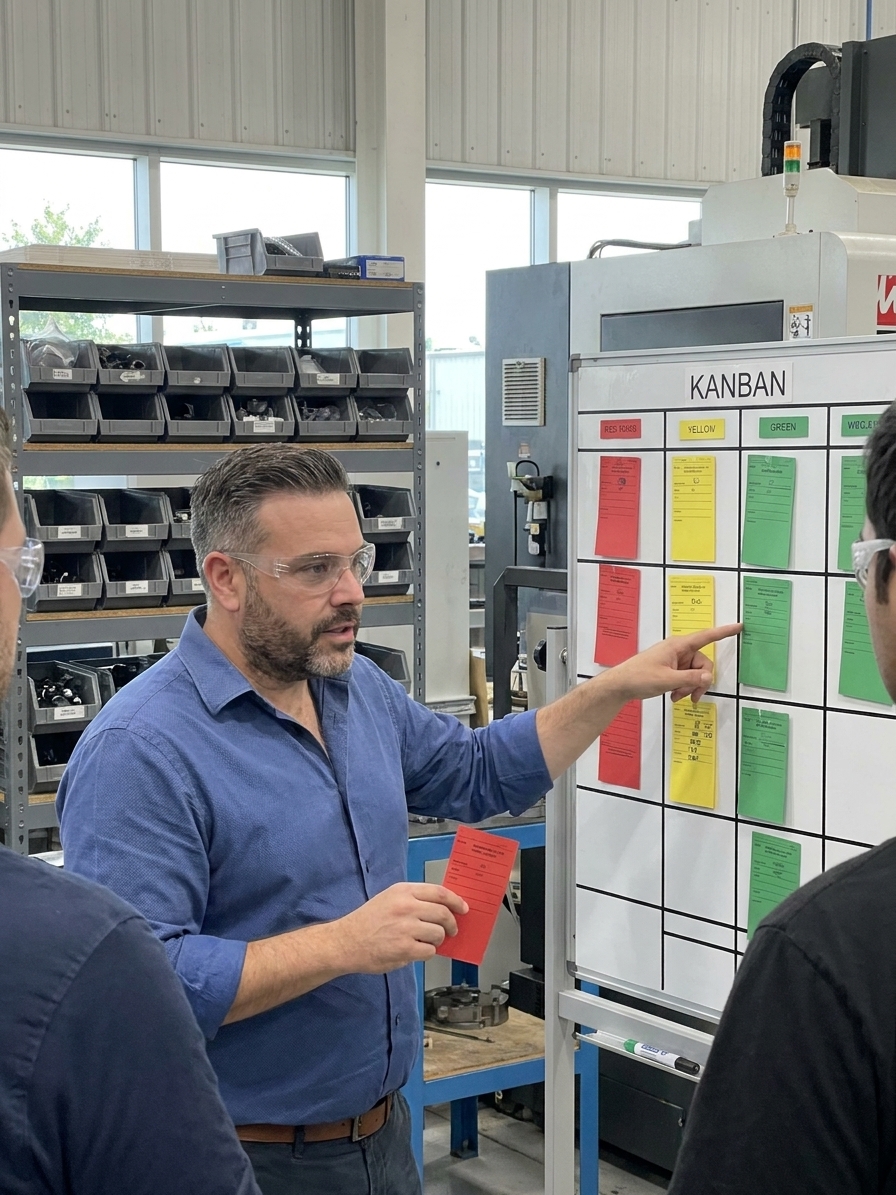
Manufacturing plants measure Kanban success by tracking whether cards exist and whether bins are present. This is a compliance audit, not a system health check. It tells you nothing about whether the pull logic is actually constraining inventory or whether the system has silently degenerated into a push flow decorated with visual markers.
Across two decades in automotive and aerospace, I have audited plants where the Kanban system looked perfect on the surface. Cards were printed, floor markings were fresh, and supermarkets were neatly organised. The metrics reported 98% card availability. Yet warehouse inventory had grown by 40% over two years, expediting costs were climbing, and nobody could explain the disconnect.
The gap exists because organisations measure the wrong things. They count inputs—cards issued, operators trained, bins labelled—rather than outputs like signal velocity, card age, and exception accumulation. A pull system is a flow control mechanism, and its health must be measured against flow parameters, not static inventory checks.
Signal Velocity: The First Indicator of Decay
Signal velocity measures the time elapsed between a container being consumed at the point of use and the replenishment signal arriving at the upstream process. In a healthy Kanban system operating with a two-hour lead time, signal velocity should be measured in minutes. When I audit a struggling pull system, this is the first metric I calculate.
Decay shows up here before it shows up anywhere else. Cards sit on desks for hours before someone walks them upstream. Electronic signals sit in queues because the scanning happened in a batch at end of shift rather than at the moment of consumption. The pull system is effectively running with inflated lead times that nobody has recalculated, and the inventory buffer silently grows to compensate.
The measurement is simple to implement. Timestamp the consumption event and timestamp the signal receipt. The delta is your signal velocity. Plot it on a control chart. When the average starts trending upward, you have early warning that discipline is eroding—weeks before the inventory buildup becomes visible in financial reports.

Card Count Variance: Measuring Exception Accumulation
Every Kanban system starts with a designed card count based on calculated demand, verified lead times, and a safety factor derived from actual variability data. This number is the inventory cap. The most dangerous metric I track in audits is the variance between designed card count and actual cards in circulation. This single number tells you whether the system's constraints are intact.
I reviewed an electronics manufacturer whose Kanban system was designed for 800 cards across a six-stage value stream. Three years later, a physical count revealed 2,100 cards in circulation. Demand had grown roughly 20%. The remaining 1,100 cards were unmanaged exceptions—temporary cards printed for supplier disruptions, quality quarantines, and demand spikes that nobody retired after the event passed.
The measurement protocol requires a complete physical card audit. Count every card, compare to the designed baseline, and categorise the variance. Temporary cards should be tagged with an expiry date and a reason code. If your temporary cards carry no expiry, you are not running a pull system. You are running a push system with an unchecked inventory growth mechanism.
Card Count Variance Thresholds
The False Confidence of Digital Kanban Data
Electronic Kanban systems promise real-time data visibility. They generate dashboards showing signal flow, inventory levels, and replenishment cycle times. This data creates a false sense of precision. A dashboard reporting 99% signal transmission means nothing if 30% of those signals were scanned in batches at end of shift rather than at the point of consumption.
The metric that matters is scan-to-consumption delay. This measures the time between actual material use and the electronic signal being registered in the system. In one automotive plant I audited, the e-Kanban dashboard showed excellent signal flow—every consumption event was eventually recorded. The scan-to-consumption delay averaged four hours. The system was operating with phantom inventory because signals lagged so far behind reality that upstream processes received authorisation based on stale demand data.
Over-automated systems compound the problem. An automated e-Kanban system that triggers supplier orders without human validation will faithfully execute its logic into chaos. When a quality issue quarantines a batch, the consumption signal stops, but the system continues reordering based on the quarantine buffer that was never designed into the algorithm. The dashboard looks healthy. The warehouse fills with unusable parts.
Measure the data quality, not the data output. Track scanning compliance as a ratio of real-time scans to total consumption events. Flag any signal generated more than 30 minutes after consumption as a delayed signal. The percentage of delayed signals is your true system health metric for digital Kanban.
Recalculation Lag: The Silent Inventory Multiplier
Kanban card quantities are calculated from four variables: average daily demand, replenishment lead time, a safety factor based on demand and supply variability, and container quantity. These variables are snapshots. When any one of them shifts materially, the card count must be recalculated. This almost never happens, and the system silently generates waste.
The standard formula is straightforward: card count equals average daily demand multiplied by lead time multiplied by the safety factor, divided by container quantity. Each variable has a common failure mode. Demand is often based on annual forecasts divided by working days rather than recent actuals. Lead time uses quoted supplier performance instead of measured replenishment cycles. The safety factor reflects someone's comfort level rather than statistical variability data.
Recalculation lag is the metric nobody tracks. It measures the time between a material change in demand, lead time, or supply reliability and the corresponding recalculation of card quantities. I have reviewed systems where demand shifted 40% from baseline and card quantities remained untouched for three years. Obsolete demand patterns created systematic overproduction of some parts and chronic shortages of others.
| Formula Variable | What Teams Get Wrong | Measured Consequence |
|---|---|---|
| Average Daily Demand | Using annual forecast divided by working days instead of trailing 30-day actuals | Systematic overproduction during demand decline phases |
| Replenishment Lead Time | Using quoted supplier lead time rather than measured cycle including variation | Insufficient buffer causing chronic stockouts under normal variation |
| Safety Factor (Alpha) | Setting based on operator comfort rather than demand and supply variability data | Hidden inventory inflation that compounds with each exception |
| Container Quantity | Defaulting to supplier packaging instead of right-sizing for point-of-use consumption | Coarse pull signals or excessive administrative overhead per cycle |
Aging Metrics: When Inventory Stops Moving
A healthy Kanban supermarket has flow. Bins arrive, sit for their designed dwell time, and move to consumption. When the pull system breaks down, inventory ages.Bins sit in the supermarket past their expected dwell time because consumption has dropped but card quantities have not been recalculated. Or bins arrive and sit because the downstream process is being fed from expedited material that bypassed the pull system entirely.
Bin aging is the most visible indicator of system dysfunction and the easiest to measure. Tag every bin with its arrival timestamp. Calculate the percentage of bins exceeding their designed dwell time. In a healthy system, this number should be below 5%. When I see aging percentages above 20%, the pull system has effectively stopped governing material flow.
A pull system is a flow control mechanism — its health must be measured against flow parameters, not static inventory checks.
Aging metrics also expose the exception accumulation problem. Temporary cards create inventory that enters the supermarket but moves slowly because it exceeds current demand. These slow-moving bins are physical evidence of unmanaged exceptions. Track aging by part number, and the parts with the worst aging will correlate directly to the parts with the most temporary card additions.
Building a Kanban Health Dashboard
The solution is a Kanban health dashboard that replaces compliance auditing with system measurement. This dashboard tracks five parameters: signal velocity, card count variance, scan-to-consumption delay for digital systems, recalculation lag, and bin aging percentage. Each parameter has a threshold that triggers action before the system collapses.
The dashboard must be reviewed monthly by someone with authority to enforce corrections. This is the critical ownership question. Without assigned accountability for Kanban system health, the metrics become another report nobody acts on. The organisations that sustain pull systems treat Kanban health the same way they treat OEE or Cpk—as a measured parameter with ownership, thresholds, and escalation rules.
The cost of measurement is trivial compared to the cost of drift. A monthly audit takes a few hours per area. A recalculation takes an afternoon when triggered by the dashboard. Compare this to the inventory inflation, expediting costs, and customer shortages that accumulate when a pull system quietly degrades into a push system for two years before anyone notices.
Start with signal velocity and card count variance. These two metrics will tell you within a single audit cycle whether your Kanban system is actually pulling or just decoration. Everything else builds from that honest assessment.