Process variation that defies standard troubleshooting usually stems from misdirected effort. Engineers recalibrate gauges, swap tools, and tweak coolant flows because the control chart says a problem exists. But without isolating the source of variation, these corrections are guesswork. I have audited plants where teams spent weeks chasing a symptom while the actual root cause hid in plain sight.
When an OEM threatens a line stoppage over a 12 µm tolerance breach on a machined shaft, you need a diagnostic tool that structures the search. Cpk values and basic SPC charts confirm the defect exists, but they do not explain its physical mechanism.
A Multi-Vari study closes that gap. Developed by Leonard Seder in 1950, it is a graphical method that breaks total process variation into three specific families. It points you directly to the physical conditions causing the defect before you spend a euro on corrective hardware or a week on a Design of Experiments (DOE).
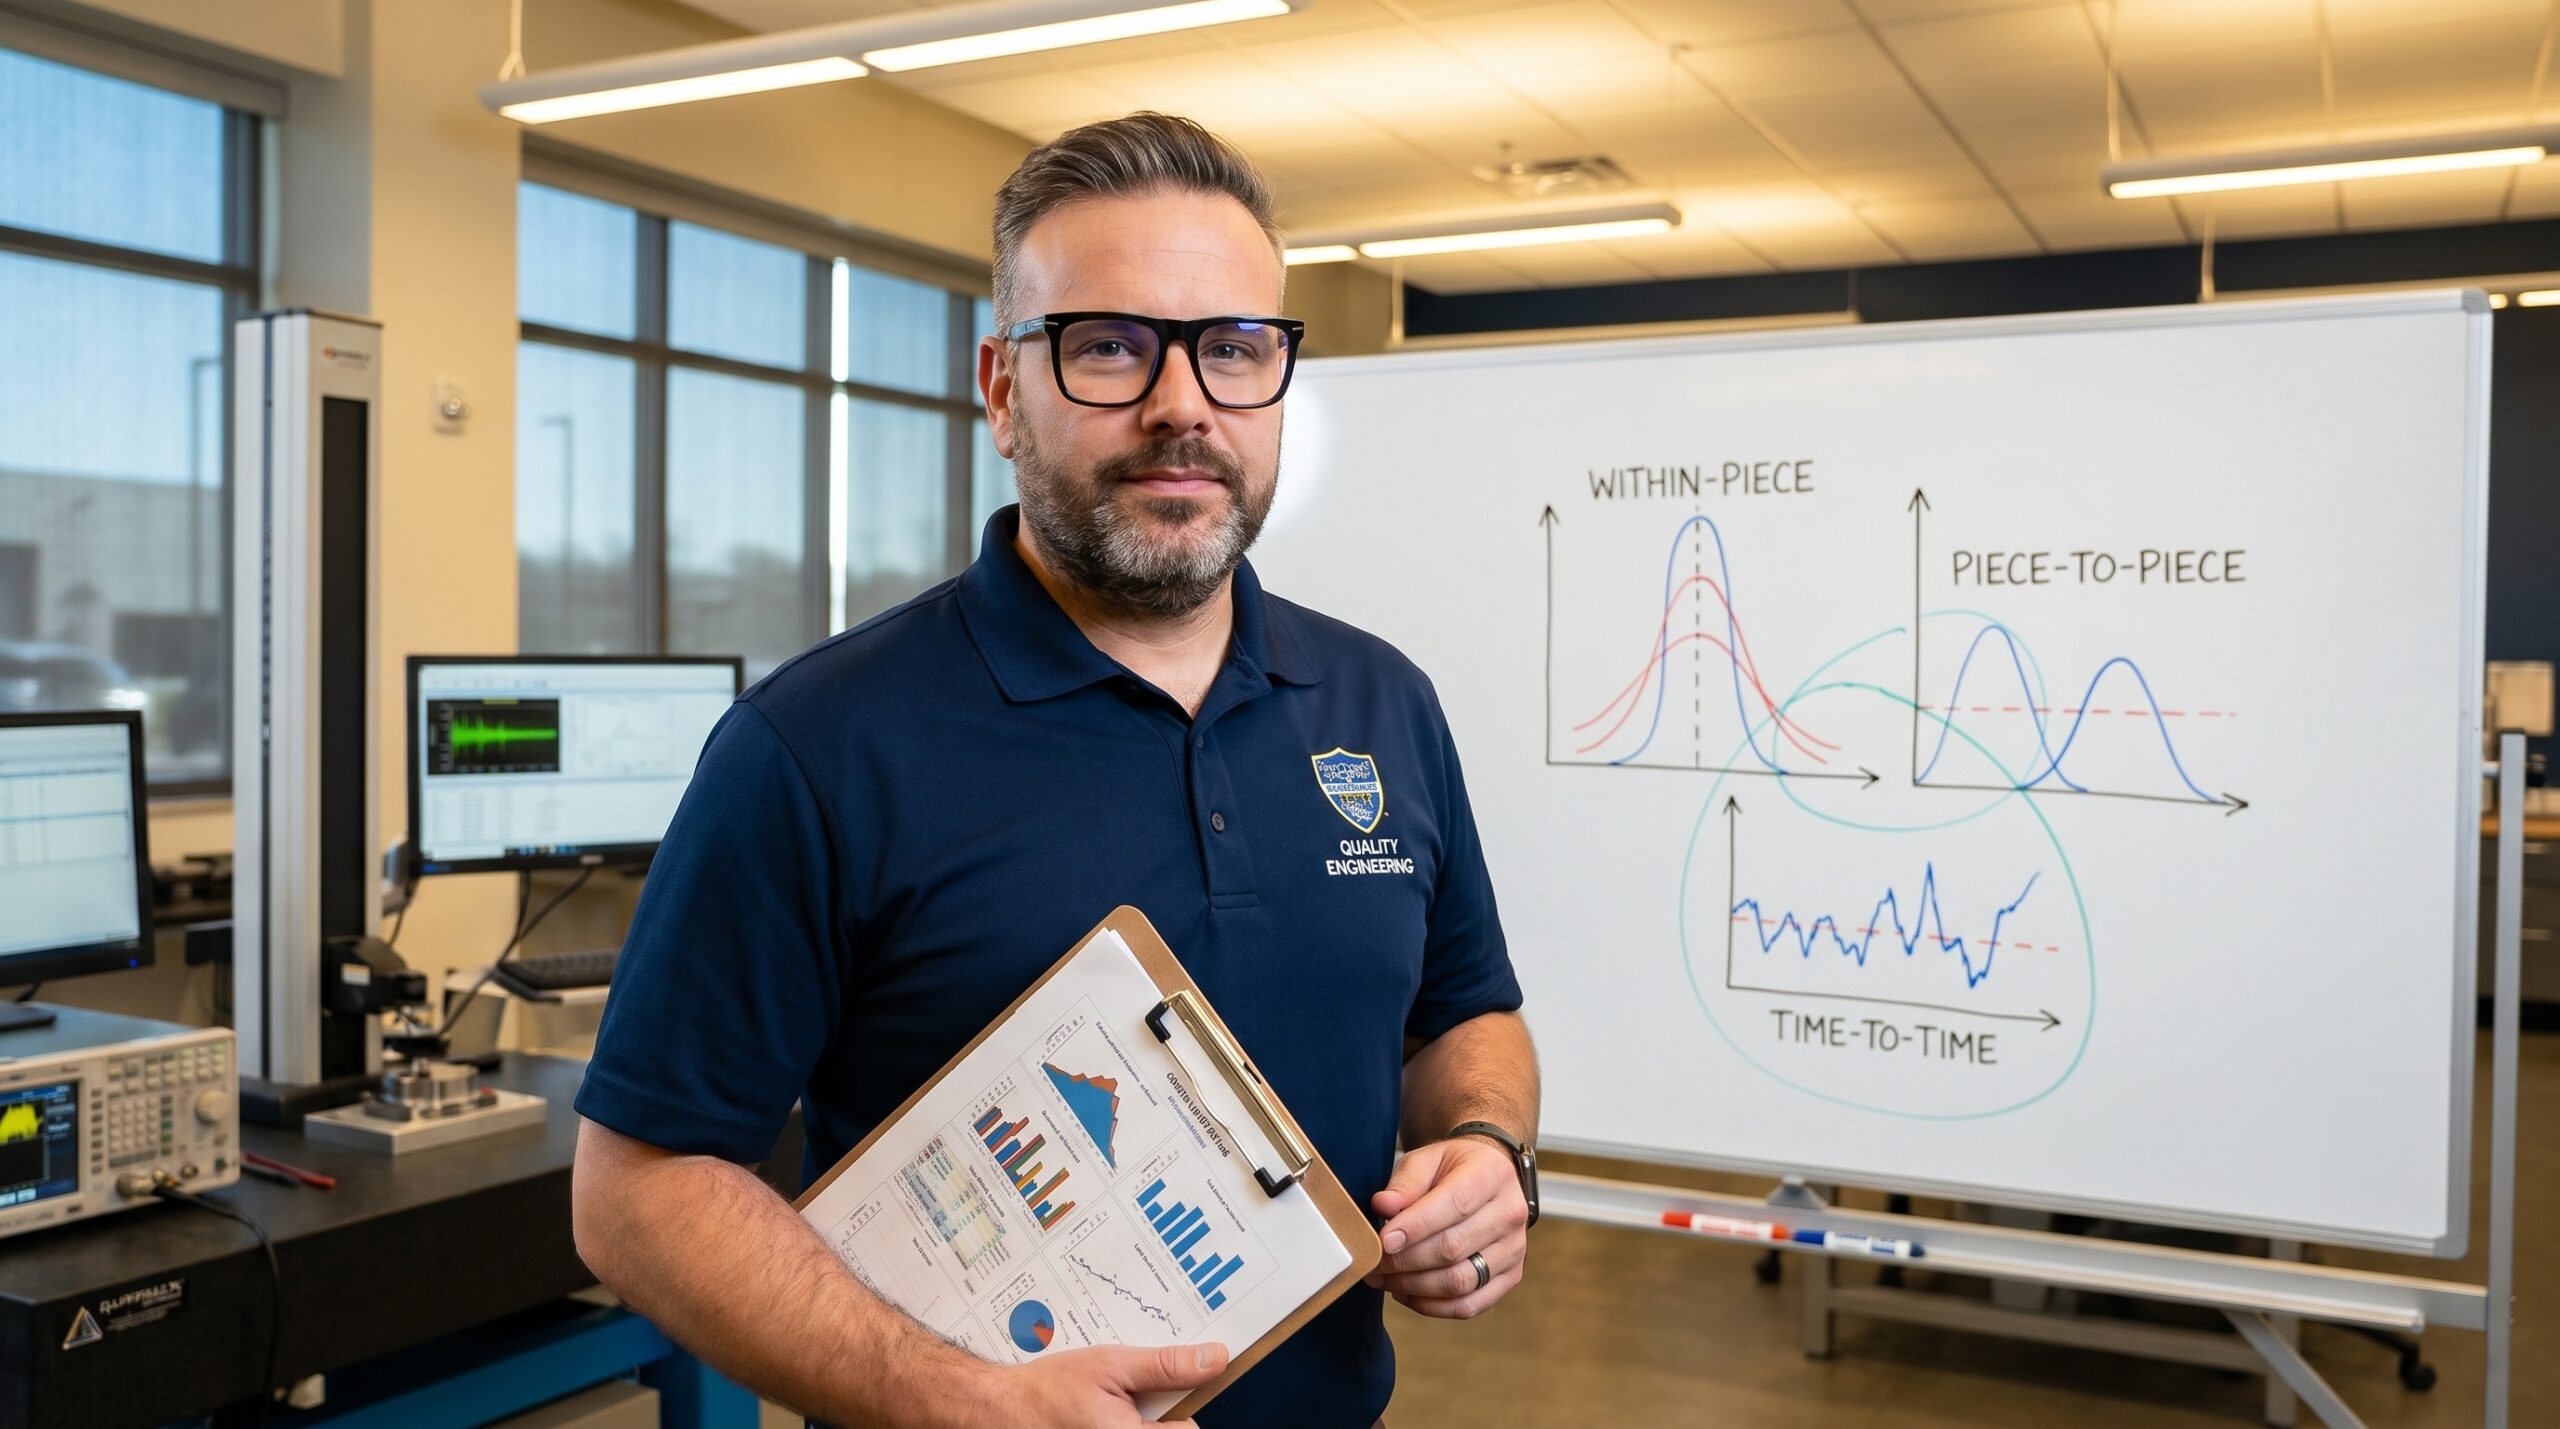
The Three Families of Variation
Traditional metrics like Cpk summarise process behaviour into a single number. They are useful for monitoring, but useless for physical diagnosis. Multi-Vari abandons the summary and visualises the raw data, categorising variation into three distinct families.
- Within-piece: Differences across a single part. If you machine a cylinder, measuring the diameter at the top, middle, and bottom reveals taper or barreling.
- Piece-to-piece: Differences between consecutive parts produced in a short time window. High variation here points to material inconsistencies, fixture play, or operator influence.
- Time-to-time: Shifts occurring over hours or days. This indicates drift caused by tool wear, thermal expansion, or environmental changes.
Consider a plant producing plastic housings. An engineer tries machine adjustments because dimensional checks keep failing, but the problem persists. A Multi-Vari study reveals the variation is entirely within-piece—warping across the mould due to uneven cooling. Adjusting the machine settings cannot fix a tooling thermodynamics issue.
In another scenario, a welding line reports fluctuating joint strength. Engineers alter welding parameters without effect. The Multi-Vari chart shows the variation is piece-to-piece, tracking exactly to inconsistent clamping pressure applied by different operators across shifts. The root causes are entirely different, but the initial symptom—unstable dimensions—looked identical.
Executing the Study: Data Collection Structure
Precision in definition is non-negotiable. State the exact characteristic (e.g., outer shaft diameter Ø25.000 ± 0.015 mm), the validated measurement system, and the specific locations on the part you will measure. If your gauge contributes significant error, the study will visualise the measurement system's variation, not the process's.
Multi-Vari Data Collection Architecture
- 01Time intervalsSelect 3-5 specific timestamps (e.g., 06:00, 08:00, 10:00, 12:00, 14:00) to capture time-to-time drift.
- 02Consecutive partsAt each timestamp, pull 3-5 parts in a row directly from the line to isolate piece-to-piece variation.
- 03Multiple positionsMeasure 3-5 distinct locations on each part (e.g., top, middle, bottom) to quantify within-piece variation.
- 04Total datasetA standard run yields 75 discrete measurements, plotted together on a single axis.
Reading the Chart
The Multi-Vari chart plots all measurements on a single graph. Time flows left to right. Vertical clusters represent the consecutive parts measured at each timestamp. Vertical lines connecting points within a single cluster display the within-piece variation.
The goal is to compare amplitudes. Look at the vertical spread of the connecting lines (within-piece). Look at the spread of points inside each time cluster (piece-to-piece). Look at the shift of the entire cluster's centre point over time (time-to-time). The family with the largest amplitude is your primary target.
| Dominant Variation | Amplitude on Chart | Probable Root Cause Area |
|---|---|---|
| Within-piece | Long vertical spans within a single part | Tool wear, fixture distortion, product design |
| Piece-to-piece | Wide spread inside a single time cluster | Material batch, machine setup, operator method |
| Time-to-time | Upward or downward shift across clusters | Thermal expansion, cumulative wear, environment |
From Data to Corrective Action
I have seen this method turn weeks of frustration into a one-day resolution. A machining line for precision transmission shafts faced a 12 µm variation in diameter. The German OEM required a tighter tolerance, threatening a delivery stoppage.
The team had calibrated the metrology equipment, swapped cutting tools, and altered coolant concentration. The problem returned within days. They were correcting variables that did not matter. We ran a standard Multi-Vari study: five timestamps, five consecutive parts, three positions per shaft. Seventy-five measurements compiled in one shift.
The chart eliminated the noise. Within-piece variation was negligible. Piece-to-piece was tight. But from 06:00 to 14:00, the mean shifted 11 µm.
The dominant variation was entirely time-to-time. We checked the coolant temperature. At 06:00, it was 18 °C. By 14:00, it had reached 32 °C. The machine's cooling circuit lacked a thermostat. As the fluid heated up, thermal expansion altered the machined geometry.
The fix was a thermostatically controlled cooling unit costing €2,800. Process variation dropped from 12 µm to 3.5 µm. Cpk improved from 0.83 to 1.52. One shift of structured measurement replaced a week of blind trial and error.
Common Implementation Errors
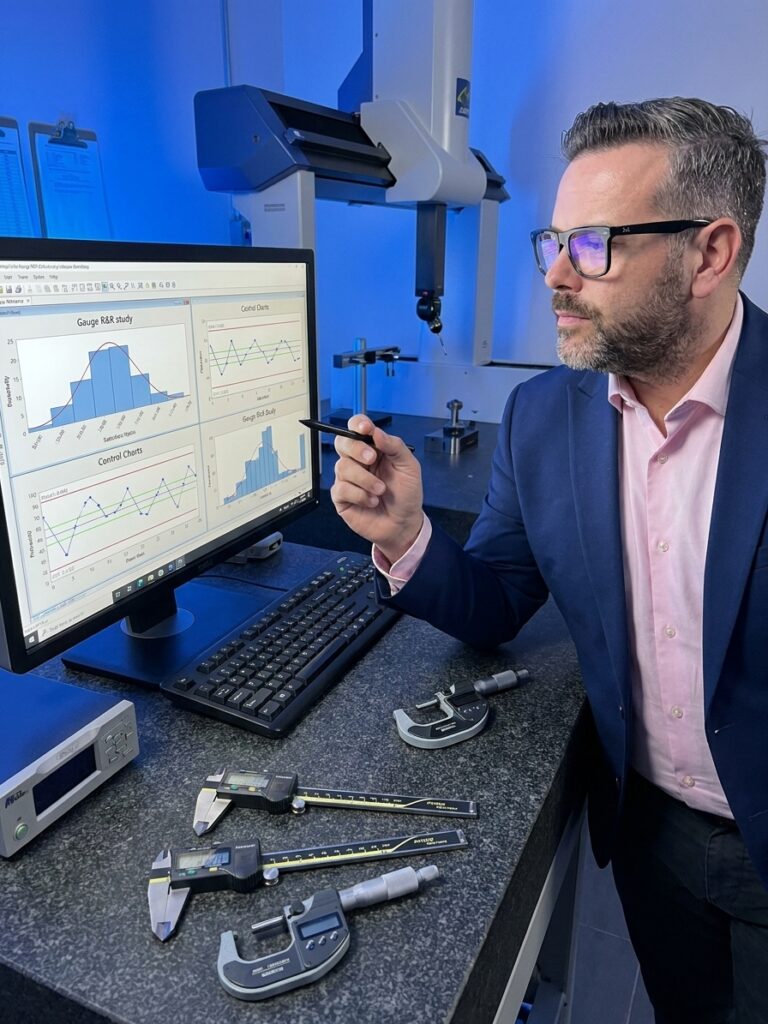
The most frequent failure is skipping the Measurement System Analysis (MSA). If your Gage R&R is above 10 percent, the variation you see in the chart belongs to the gauge, not the manufacturing process. Verify the measurement system first.
Engineers also fail by logging only two time intervals. Two timestamps are two data points; they cannot establish a trend. You need three to five intervals to distinguish a genuine drift from random noise. Furthermore, teams often record the dimensional data but fail to log contextual factors like ambient temperature, material lot, or operator name.
Finally, do not apply this tool to stable processes. If your process is in statistical control and Cpk exceeds 1.33, a Multi-Vari study will only confirm what you already know. Save the effort for the processes that actually require diagnosis.
The Necessary Precursor to DOE
Jumping straight into a Design of Experiments (DOE) without understanding the structure of variation wastes resources. DOE tests specific factors. If you do not know whether your problem is driven by time, material, or fixture geometry, you will test the wrong variables.
Unstructured vs. Structured Troubleshooting
Reactive guessing
- Adjusting machine offsets when Cpk drops
- Swapping tools blindly after a customer escape
- Running a DOE on every conceivable factor
- Increasing inspection frequency to catch defects
Structured diagnosis
- Verifying MSA before trusting any data
- Running a Multi-Vari study to isolate the source
- Targeting the dominant variation family only
- Using DOE to optimise the proven significant factors
Modern inline metrology and Industry 4.0 systems can automate Multi-Vari data collection. Software generates the charts in real time. But the algorithm cannot interpret the physics. The engineer still must read the chart, identify the dominant variation family, and connect it to the process mechanics.
Data collection is only useful if it drives specific physical corrections. Multi-Vari forces you to ask the right question: where is the variation actually coming from? Once you see the answer on the chart, the corrective action is usually straightforward.