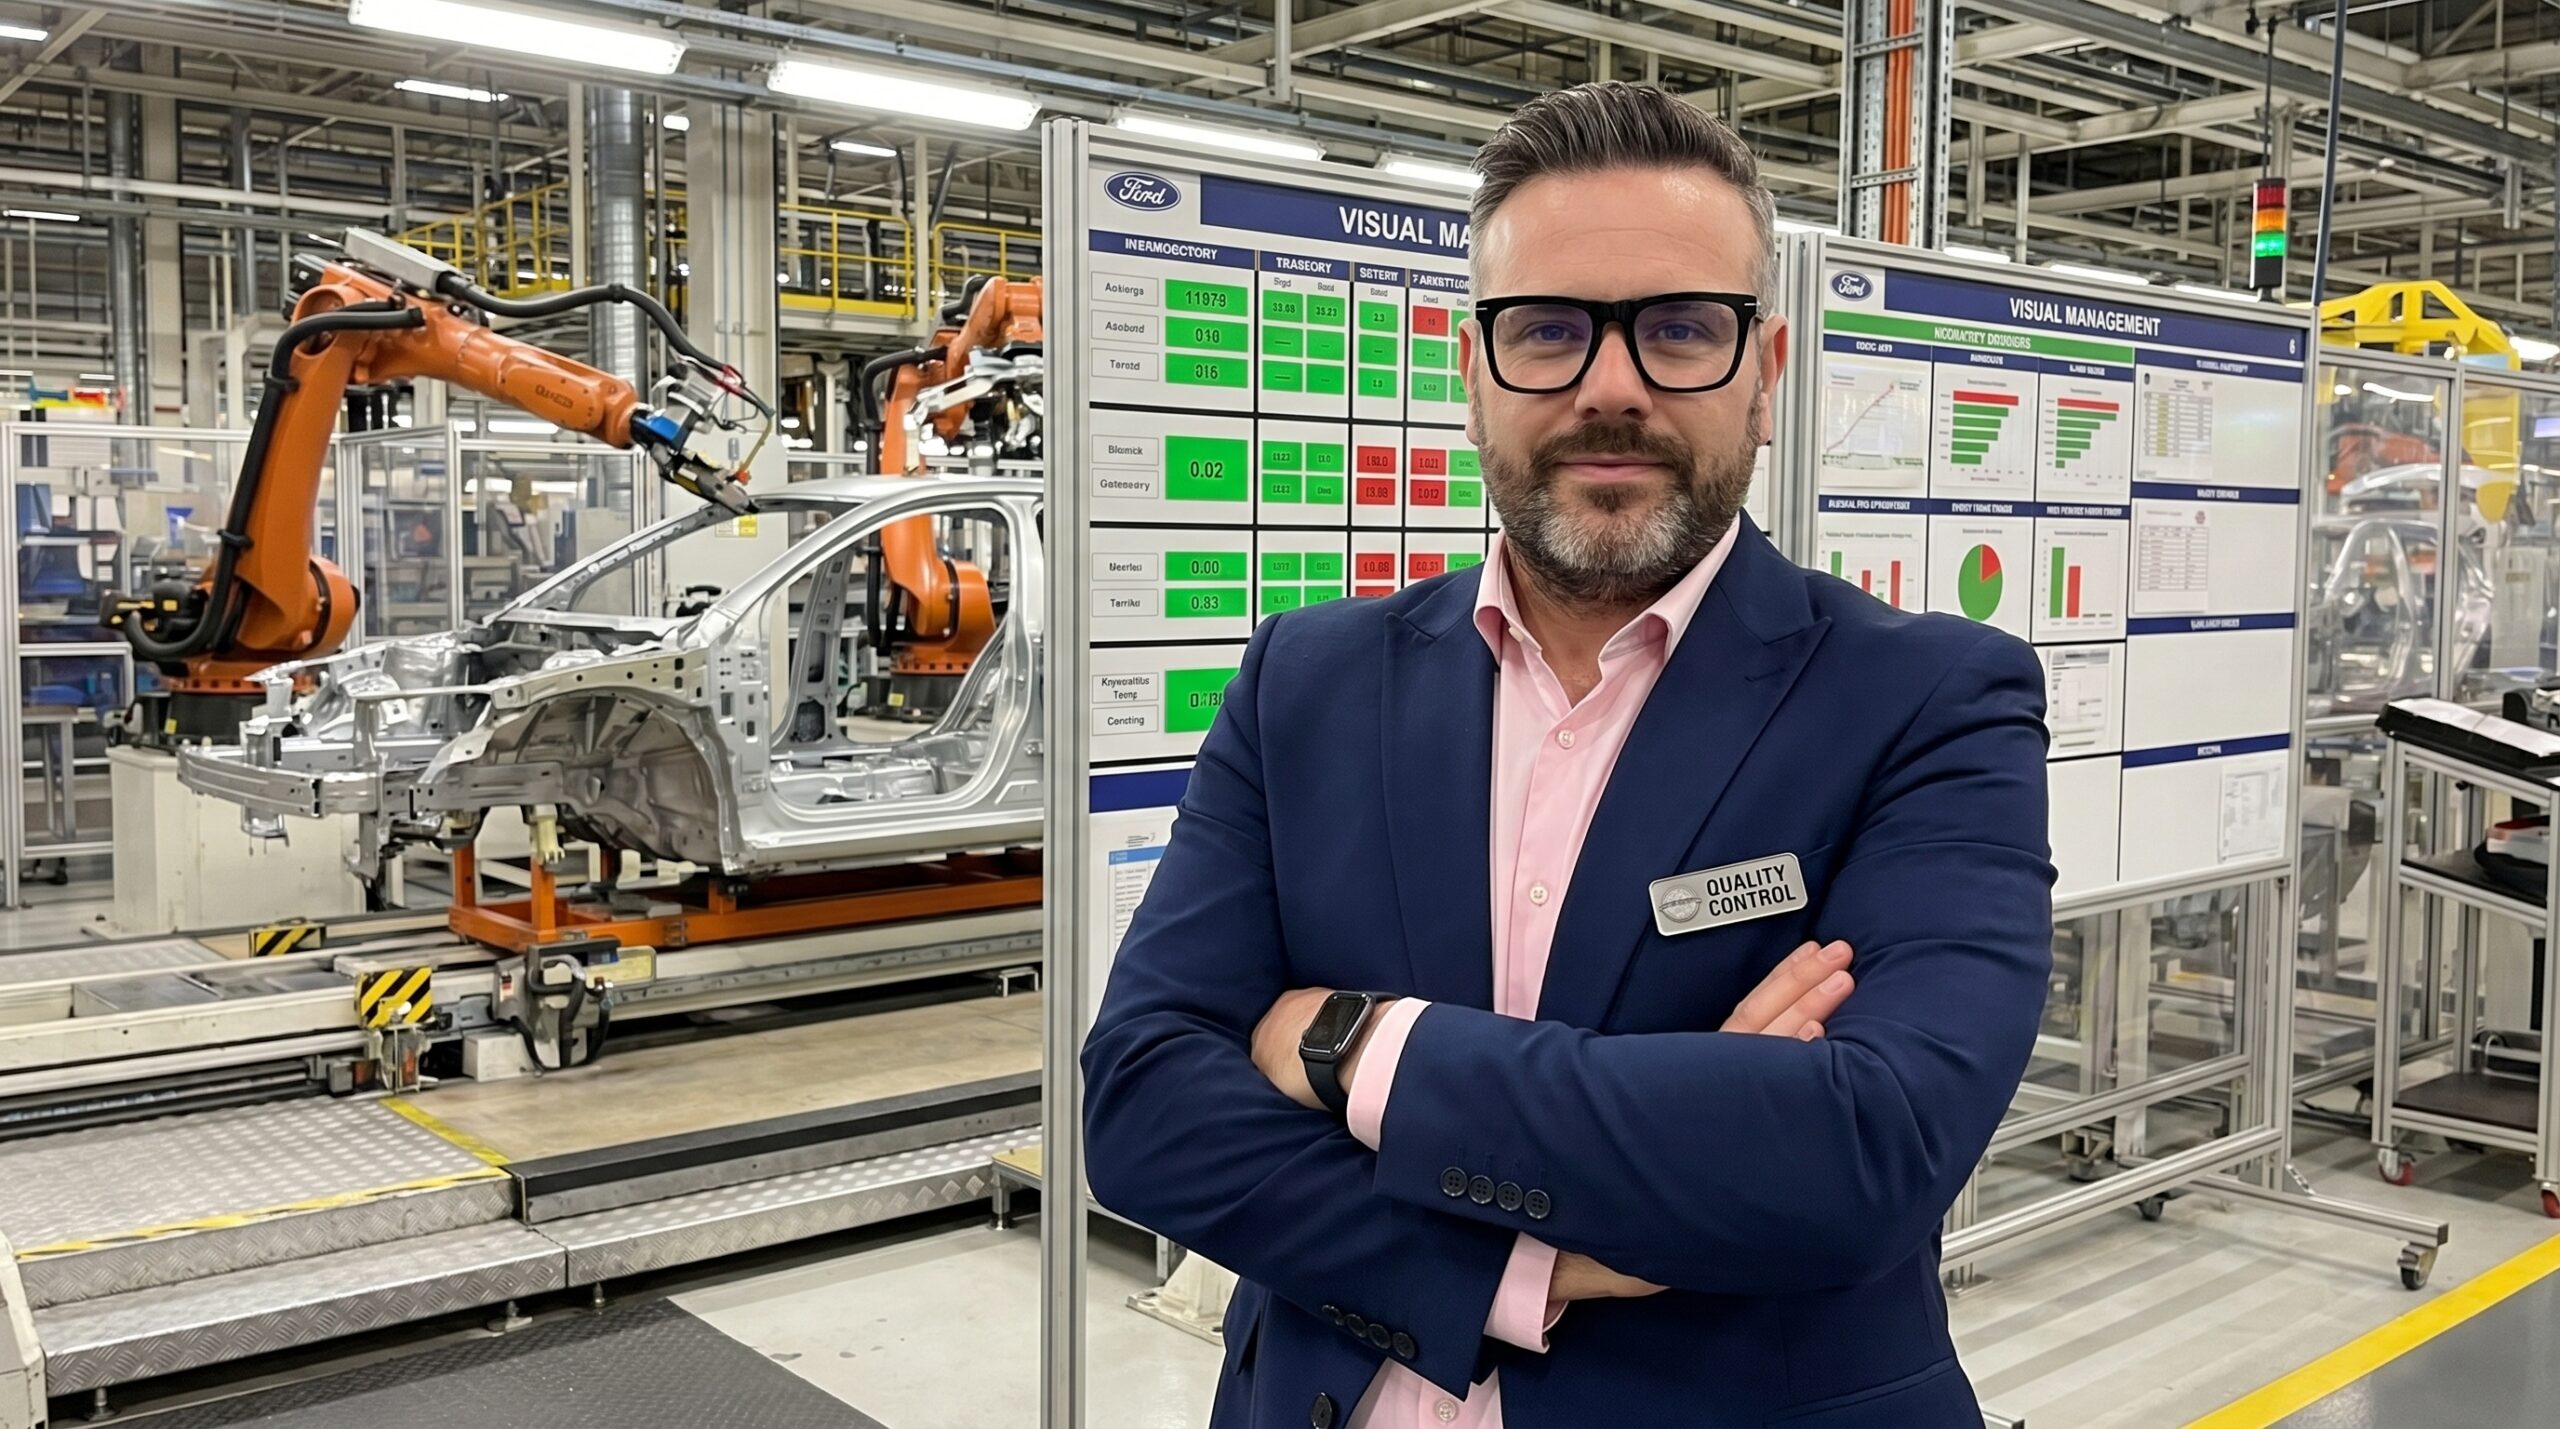
I have audited plants that boasted three years of Lean implementation. They had visual management boards, rigorous 5S audits, and functional Andon systems. Yet their lead times were climbing, defect rates were rising, and operators were visibly exhausted. When I asked the quality manager about the disconnect, he shrugged. They had the Lean tools, so they assumed the execution was correct.
They had the mechanisms, but they lacked the operational understanding. They were missing a fundamental principle of the Toyota Production System: the interlocking triad of Muri, Mura, and Muda. Three Japanese words that describe the complete anatomy of process failure. While most organisations focus exclusively on Muda, they are ultimately treating a symptom while ignoring the disease.
Muda is the waste you see. Muri and Mura are the conditions that create it. If you eliminate Muda without resolving the underlying overload and unevenness, the waste will return. It is a mathematical certainty driven by process constraints.
Muda: The Visible Waste
Muda translates directly to waste. It is any activity that adds cost without adding value from the customer's perspective. Toyota classified these into specific categories to help practitioners identify inefficiencies during Gemba walks. Most facilities that claim to practise Lean focus entirely here.
They map their value streams, hunt for these specific wastes, and launch kaizen events to eliminate them. This approach is useful, but inherently limited. Eliminating Muda is like prescribing paracetamol for a fever. It might suppress the symptom temporarily, but the underlying infection continues to spread.
Muda is a downstream result, never the root cause. When you see scrap piling up at a workstation, that defect is the Muda. The reason the defect was generated in the first place is rooted entirely in upstream conditions. Those conditions are always governed by Muri and Mura.
Focusing exclusively on Muda creates a reactive maintenance loop. Quality teams become firefighters, extinguishing waste wherever it flares up. To build preventive quality systems, you must elevate your diagnosis to the conditions that allow the fire to start.
Muri: The Overload That Breaks the System
Muri means overload, overburden, or unreasonableness. It occurs when you demand more from a machine, process, or operator than its designed capacity. I have seen automotive lines targeted to run 480 parts per shift on machines cycle-rated for 400. Instead of engineering the bottleneck, management increases the pressure.
The operator is forced to move faster. Maintenance skips preventive schedules to keep the line running. Quality control shifts from 100% inspection to random sampling because the cycle time will not allow it. This forced overdrive degrades every parameter simultaneously.
The overloaded machine fails because it runs beyond its tolerance limits. The hurried operator makes assembly errors. Defects reach the customer because inspection was bypassed. By demanding the impossible, the system collapses and generates entirely new categories of Muda.
Overloading a process guarantees quality degradation. When you push a system past its limits, you do not achieve higher output. You achieve higher scrap, higher downtime, and compromised safety.
Mura: The Irregularity That Drives Defects
Mura translates to unevenness, inconsistency, or variability. It describes a process that lacks a stable rhythm, alternating between chaotic peaks and complete stagnation. This boom-and-bust cycle is deeply destructive to quality management.
Variability is the direct enemy of quality. A stable process produces predictable, conforming results. An unstable process, where speeds, pressures, material lots, and operator shift patterns constantly fluctuate, produces unpredictable defects. Statistical Process Control (SPC) cannot stabilise a process that is intentionally destabilised by the production schedule.
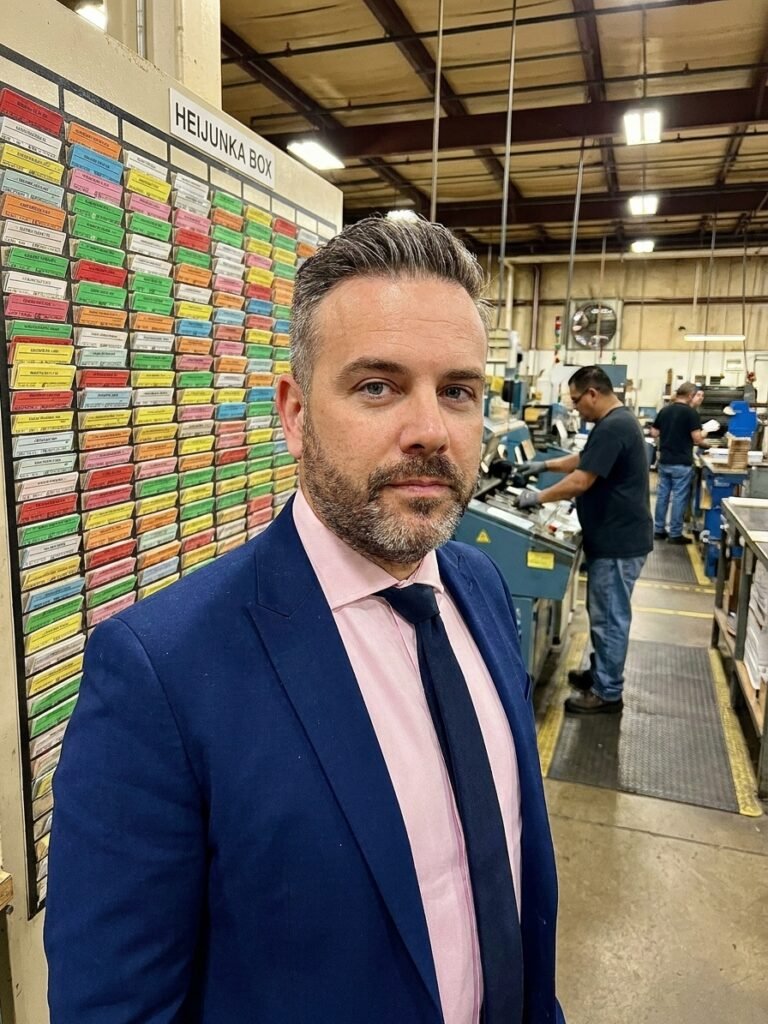
This is exactly why Toyota invented Heijunka, or production levelling. Instead of building 500 units of Model A on Monday and 500 units of Model B on Tuesday, they produce a repeated mix of 100 A and 100 B every single day. This establishes a standard rhythm, standard parameters, and ultimately, standard quality.
You cannot inspect quality into a product, and you cannot schedule stability into a process that planning has intentionally destabilised.
When schedules change five times per shift based on which customer is screaming loudest, operators never reach a steady state. Every changeover introduces new variables. Every urgent order forces a deviation from the standard work.
How Overload and Unevenness Generate Waste
Plants fail when they tackle Muda in isolation. They remove excess inventory or waiting times, but ignore the Muri and Mura driving them. Consequently, the waste returns within a quarter. This is the fundamental reason Lean initiatives stagnate. Organisations fight symptoms while the disease thrives.
When you overload a system, you generate defects, excess motion, and rework. When you run an uneven production schedule, you generate waiting times, overproduction, and bloated safety buffers. The relationship is causal and absolute.
The Causal Chain of Process Failure
- 01Muri or Mura imposedManagement sets targets beyond capacity or constantly alters the production schedule.
- 02System destabilisesMachines run beyond limits, preventive maintenance is skipped, and operators rush.
- 03Process parameters deviateVariables fluctuate, standard work is abandoned, and SPC control limits are breached.
- 04Muda is generatedDefects, scrap, rework, and downtime emerge as symptoms of the forced conditions.
Eliminating waste requires harmonising the system. Remove the unreasonable demands of Muri. Level the volatility of Mura. The Muda will contract organically as your process stabilises.
A Practical Diagnostic Approach
Over years of transitioning ISO 9001 and IATF 16949 systems, I developed a systematic method to break this cycle on the shop floor. It requires structured observation and the discipline to measure capacity against actual demand.
First, identify the visible waste during a Gemba walk. Map where the flow stops, where material accumulates, and what is being scrapped. Critically, do not attempt to solve the waste yet. Document it and move immediately to the upstream conditions.
Second, hunt for the overload. Ask if the waste exists because the system is being pushed past its limits. Check Overall Equipment Effectiveness (OEE) trends, unplanned downtime logs, and operator absence rates. If machines are failing or people are quitting, you are demanding too much.
Third, expose the unevenness. Analyse the frequency of schedule changes, the ratio of rush orders, and the stability of material deliveries. Review your SPC charts to see if you are tracking natural variation or total chaos driven by constant changeovers.
Indicators of Systemic Overload
Finally, resolve the conditions. If you found Muri, increase capacity or reduce the requirement. Reallocate the workload, enforce preventive maintenance, or reject unrealistic delivery promises. If you found Mura, implement Heijunka, standardise changeovers via SMED, and establish a repeatable daily rhythm.
Stabilising the Line: A Reality Check
I was brought into a plant producing automotive components where the line was in constant crisis. Scrap rates hovered at 8%, shipments were delayed by weeks, and operators worked mandatory overtime. Previous Lean consultants had run 5S workshops and mapped the value stream. The metrics improved briefly, then reverted within a month.
The root causes were glaring. Experienced operators worked the morning shift, while night shifts were staffed by novices. Management ran the machine at 120% speed to compensate for delays. The production schedule changed seven times per shift, cycling through five different products without standardised changeovers.
The solution was deliberately methodical. We reduced the machine speed to 95%. Scrap immediately dropped from 8% to 2.5% because the equipment finally operated within its designed parameters. We yielded more functional parts in less time by slowing down.
We levelled the production schedule via Heijunka, reducing the product mix to three items per day. We implemented SMED, cutting changeover times from 45 minutes to 12. We stabilised the material supply chain with a timed milk-run delivery system, eliminating the boom-and-bust inventory cycles.
Within three months, scrap fell below 1.5%. Shipments moved on time, and overtime dropped by 70%. The system stabilised because we eliminated Muri and Mura. Quality became the natural byproduct of a process operating within its limits.
The Management Courage to Stop Overloading
Muri and Mura persist because they are politically uncomfortable concepts. Resolving them requires management to say no. No, we cannot increase line speed by another 10%. No, we cannot inject another product variant without a capacity analysis. No, we cannot commit to a two-week lead time when our actual process requires three.
Focusing exclusively on Muda is safer. Hanging a visual management board or running a 5S cleanup event creates the illusion of progress. But if the system beneath those clean workspaces continues running at 120% capacity with a fluctuating schedule, the progress is a facade.
Sustainable quality engineering demands systemic discipline. The next time a defect appears on your line, do not just document the nonconformance. Stop and diagnose the environment. Eight times out of ten, you will find that overload or variability forced the failure.