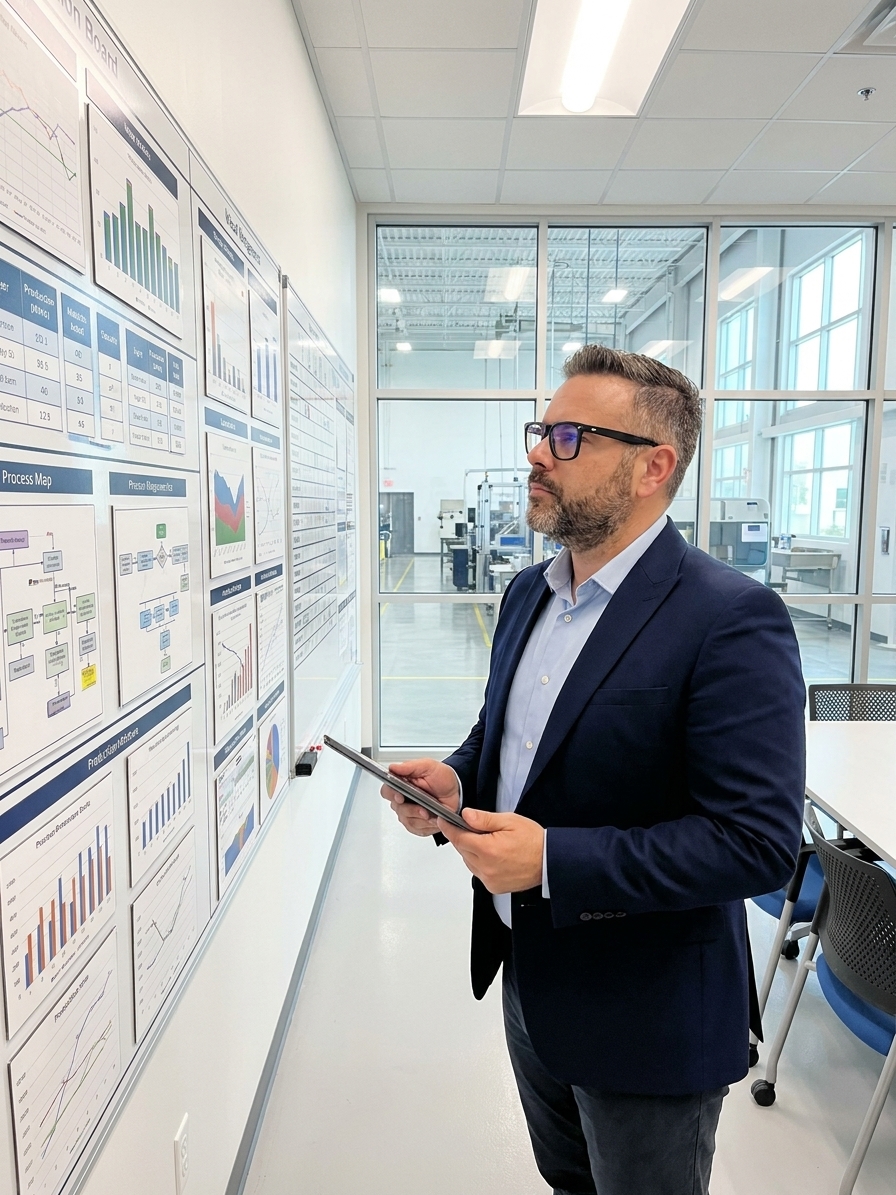
Walk into any modern manufacturing facility and you will eventually find a room with walls covered in charts, metrics, and process maps. Someone will call it the Obeya. They will explain how Toyota pioneered the concept to coordinate the Prius project, and how it accelerates cross-functional decision-making. Then ask when the team last met there to solve a problem.
The silence that follows is the standard failure mode. The gap between a functioning Obeya and a decorated conference room is the gap between a cockpit and a waiting area. Both have screens, but only one is designed for flying. Most organizations skip the engineering discipline required for visual management and go straight to printing A3 reports.
An effective Obeya is a management system, not an interior design project. I have audited plants where the visual management room looked pristine during executive tours but served zero operational purpose. The charts were three quarters out of date, the action log had no owners, and the actual work was happening in corridor discussions. The room had become a bottleneck.
The Mechanics of an Effective Obeya
The core principle is simultaneous presence of information and decision-makers. When a problem surfaces during a daily stand-up, the people who can solve it are already in the room. The data they need is already on the wall. There is no 'let me get back to you' or 'I will send the latest version'. Everything is live, visible, and shared.
Physical space matters. The room should hold eight to fifteen people standing comfortably. Walls must be magnetic or push-pin-friendly. Arrange the room so the most critical information faces the entrance. This headline wall holds project status, top risks, and key milestones. Side walls hold supporting data: detailed metrics, action logs, and problem-solving boards.
Paper on walls forces simplicity. Digital dashboards encourage detail that nobody reads. A projector is useful for sharing temporary data, but the primary information medium should be physical. When you run out of wall space, you are forced to prioritize. This constraint is a feature, not a limitation. It prevents the room from becoming an archive.

Information Architecture Over Decoration
Every piece of information on the wall must answer a specific question. If you cannot articulate the question the chart answers, the chart does not belong there. An Obeya with fifty visual elements communicates nothing. Twelve well-chosen metrics will always outperform a dense wall of data.
The architecture must map to operational reality. Project status tracks milestones against plan. Quality metrics answer whether you are delivering to spec, using real-time defect rates and open non-conformance reports (NCRs). Top risks identify what could derail the program, supported by a living risk register with mitigation status.
| Wall Section | Question Answered | Typical Content |
|---|---|---|
| Project Status | Where are we against plan? | Milestone tracker, Gantt summary |
| Quality Metrics | Are we delivering to spec? | Defect rates, FPY, open NCRs |
| Top Risks | What could derail us? | Risk register with mitigation status |
| Action Log | Who is doing what by when? | Open actions with owners and dates |
| Problem Board | What is blocking us now? | Active issues with escalation level |
The action log is the most critical element. It dictates who is doing what by when. If a metric on the wall is not driving a decision or an action item, it is decoration. Remove it. Hand-drawn charts updated daily are more valuable than professionally printed posters updated quarterly. The signal is in the freshness.
Cadence and Meeting Protocols
The daily stand-up is the heartbeat. Fifteen minutes maximum, standing only. The team walks the wall from left to right, top to bottom. Each person speaks briefly: what they completed, what they are working on, and what is blocking them. Blockers are captured on the problem board immediately.
Weekly reviews go deeper. Thirty to sixty minutes. The focus shifts from individual updates to systemic issues: trends in the metrics, risks that are escalating, and actions that are overdue. This is where decisions get made. Not in side conversations afterward, but in the room, with the information visible to everyone.
Milestone tollgates are the most rigorous. A full review of project health against predefined criteria. Green items get brief acknowledgment. Yellow items get a plan. Red items get an owner, a deadline, and an escalation. If a tollgate cannot be passed, that decision is made in the Obeya, not deferred to a steering committee.
Behavioural Norms and Escalation
The hardest part of Obeya is not the physical setup. It is the cultural shift required to use it effectively. Silence is not consent. If someone disagrees with an assessment on the wall, they must say so in the room. Passive agreement followed by corridor complaints destroys the system.
Escalation is expected, not punished. When a problem exceeds the team's authority, it gets escalated visibly. The escalation path must be posted on the wall: who is notified, how quickly, and with what level of detail. Teams that hide problems to avoid looking bad will never benefit from visual management.
The moment metrics on the wall are tied to individual performance reviews, people will start gaming them.
The room is for working, not presenting. If someone brings a polished PowerPoint to the Obeya, they have misunderstood the purpose. The information should already be on the walls. The meeting is for discussion, decision, and action. Do not use the Obeya as a performance evaluation tool. Reward problem-solving, not problem-hiding.
Measuring Obeya Effectiveness
How do you know if your Obeya is working? You measure it like any other process. Track decision velocity: are decisions being made in the room, or deferred? Action completion rate is a hard metric. A healthy Obeya maintains above 85% on-time action closure. Below 60% means the action log has become a wish list.
Problem dwell time is equally critical. How long do issues stay on the board before resolution? If the same problem has been on the wall for three weeks, the team is either under-resourced or avoiding a difficult conversation. Participation breadth matters: silence from a function usually means they are solving problems outside the room.
Core Obeya Health Indicators
Visitor comprehension is the final test. When someone unfamiliar with the project walks into the Obeya, can they understand the current status in under two minutes? If not, the visual design needs simplification. The room must communicate project health instantly to anyone who walks in, from operators to executives.
Digital Obeya and Hybrid Limitations
Distributed teams can approximate Obeya using digital whiteboards and video conferencing. The visual principles transfer. The meeting protocols transfer. What does not transfer is ambient awareness. You lose the ability to glance at the wall while walking past, to overhear a conversation and contribute, to feel the collective energy of a team solving a problem.
For hybrid arrangements, use a physical Obeya at the primary site with a continuous video feed for remote participants. Some teams install cameras that remote members can control to pan and zoom on specific wall sections. This preserves more of the Obeya's intent than a purely digital approach.
The biggest risk with digital boards is that screens become scrollable. Physical walls have a forcing function: when you run out of space, you must remove something. Digital boards expand infinitely, which means they accumulate clutter. Apply the same discipline. If a chart is not driving a decision, remove it from the digital workspace.
Start small. Pick one critical project. Identify the eight to twelve people who can make decisions. Define six to ten metrics that actually drive decisions. Establish a daily stand-up and a weekly review. Run it for ninety days. If decisions are not being made faster and problems are not being surfaced earlier, the problem is not the room. It is the culture, the cadence, or the selection of people. Fix those before investing in better charts or bigger walls.