
I was standing at an injection moulding machine in an automotive plant when I first understood what Overall Equipment Effectiveness (OEE) actually measures. The plant manager pointed to the daily production report, which showed the machine running at 95% efficiency. He was confident in the number. Three days later, after we rigged up proper measurement, we found the real effectiveness was 61%.
That machine was switched on, cycling, and drawing power. But it was not producing saleable parts. It waited for material. It waited for tooling changes. It waited for maintenance sign-off. It waited for an operator returning from a break. The machine was technically running, but from a value-creation standpoint, it was entirely idle.
This gap between perceived and actual productivity is what OEE exposes. It is not a motivational metric or a dashboard gimmick. It is a manufacturing mirror that reflects the brutal, physical truth of your shop floor. If you want to find capacity without buying a new machine, you have to measure exactly where your existing capacity is leaking.
The Anatomy of OEE: Availability, Performance, Quality
OEE multiplies three distinct factors: Availability, Performance, and Quality. Each factor isolates a specific dimension of equipment function. Availability asks if the machine is running during planned production time. Performance asks if it is running at its optimal theoretical cycle time. Quality asks if the parts produced actually meet specification.
Consider a standard 480-minute shift. A machine experiences 45 minutes of unplanned downtime due to a mechanical fault, and loses another 20 minutes waiting for setup. The actual run time is 415 minutes. Availability is calculated as 415 divided by 480, which equals 86.5%. That is a decent number on its own, but it leaves out the realities of speed and scrap.
Now examine performance. During those 415 minutes of run time, the machine should have produced 830 parts based on an ideal 30-second cycle. It only produced 700. The performance rate is 700 divided by 830, yielding 84.3%. Finally, assess quality. Of the 700 parts moulded, 42 had flash, scratches, or dimensional failures. With 658 good parts, the quality rate drops to 94.0%.
The 68.5% Reality Check
When we multiply 86.5% by 84.3% by 94.0%, the true OEE is 68.5%. The machine that supposedly ran at 95% capacity was wasting nearly a third of its potential. World-class OEE is generally considered to be 85%, comprising 90% availability, 95% performance, and 99.9% quality. OEE is not about achieving perfection; it is about systematically identifying and quantifying these specific losses.
The Six Big Losses That Destroy Productivity
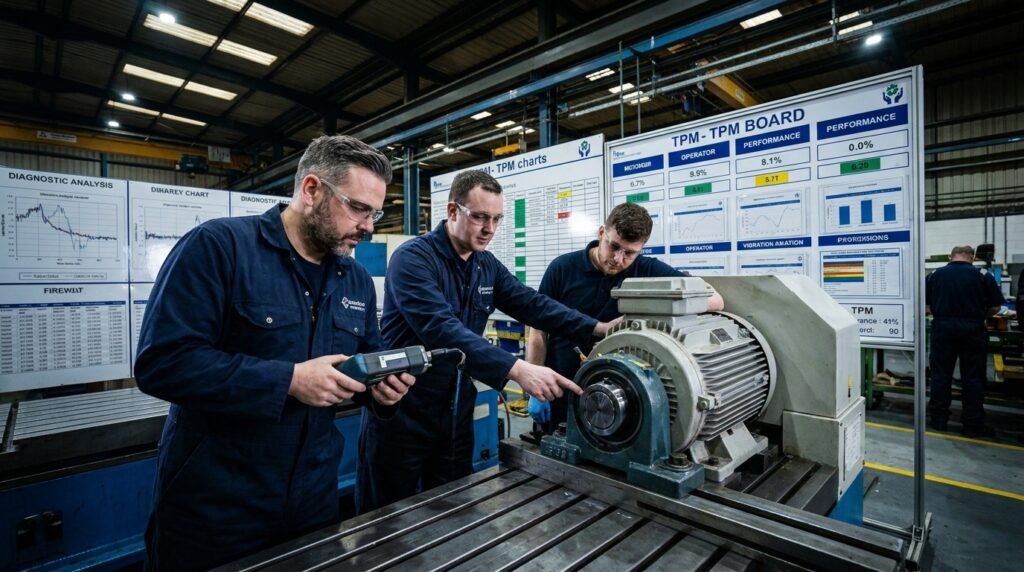
To improve OEE, you must categorise where the losses occur. The Total Productive Maintenance (TPM) framework defines six major losses that drain equipment effectiveness. These losses map directly to the three OEE factors, providing a standardised taxonomy for root cause analysis.
Availability losses include equipment breakdowns and setup adjustments. Breakdowns are unplanned stops caused by mechanical, electrical, or software failures. Setup time is the minutes lost changing programmes, swapping moulds, or calibrating the machine until the first good part is verified.
Performance losses consist of minor stops and reduced speed. Minor stops are brief interruptions lasting seconds, often caused by a misaligned sensor or a jammed feeder. Reduced speed occurs when operators deliberately run the machine below its nominal cycle time to prevent jams or compensate for worn tooling.
Quality losses are divided into production defects and startup rejects. Defects are parts failing inspection during steady-state production due to dimensional variation or contamination. Startup losses are the scrap parts generated immediately after a setup or maintenance event while the process stabilises.
Hidden Minor Stops: The Silent Capacity Killer
I have audited plants that chased major breakdowns aggressively while ignoring minor stops completely. In one facility, our loss analysis showed minor stops accounting for 48 minutes of lost production per shift — nearly a full hour of capacity. Because no single stop exceeded three minutes, the shift logbooks recorded them as continuous running time.
We installed a simple inductive sensor to log every cycle interruption lasting longer than five seconds. The data revealed the machine was stopping an average of 147 times per shift. The root cause was a sticky material feeder. The operator had been clearing the jam manually without recording it, believing it was too minor to report.
By redesigning the material feed guide and replacing a worn nozzle, the minor stops dropped to 12 per shift. OEE on that single machine jumped from 61% to 74% within a week. We did not buy new software or overhaul the machine. We simply measured the hidden loss and engineered it out.
Technology without process understanding is an expensive toy. Measure the loss first, then automate.
Deploying OEE: Start Small and Scale
Do not attempt to roll out OEE across an entire factory simultaneously. Select one bottleneck machine or the asset causing the highest scrap cost. Define the planned production time rigorously. Planned production time explicitly excludes scheduled maintenance, official breaks, and meetings, but it includes time lost waiting for material or operators.
Choose a data collection method that fits your operational maturity. Fully manual tracking on paper relies on operator diligence and is prone to error. Fully automated Industry 4.0 systems utilising PLCs and IoT sensors provide precise, real-time OEE calculations but require significant infrastructure investment.
The most effective starting point is semi-automated tracking. Let the machine log its own running status automatically, while operators select downtime reasons from a simple HMI interface. This approach delivers 80% of the data accuracy at 20% of the cost, preventing the system from becoming an administrative burden.
The OEE Implementation Cycle
- 011. MeasureSelect pilot machine and establish baseline OEE through semi-automated data collection.
- 022. CategoriseMap every minute of loss to one of the six standard TPM categories.
- 033. AnalyseApply Pareto to target the top three loss drivers.
- 044. ImproveExecute corrective actions prioritising quick wins.
- 055. StandardiseUpdate work instructions to lock in the gains.
Once you have data, categorise every minute of lost time strictly. Do not accept a category for unexplained or miscellaneous downtime. If you cannot categorise a loss, you do not understand the process well enough. Apply the Pareto principle: focus your engineering resources on the top 20% of root causes driving 80% of the losses.
Common Failures in OEE Implementation
The most damaging mistake is weaponising OEE. If management uses the metric to penalise operators or red-flag teams on large display boards, the data will be manipulated. Operators will invent reasons to mask downtime or falsify cycle counts. OEE must be deployed strictly as a diagnostic engineering tool, never as a HR performance stick.
Another critical failure is fixating on the aggregate OEE percentage. A headline number of 65% tells you nothing actionable. However, knowing that your availability is 92%, performance is 78%, and quality is 90% points you directly to the problem. You do not have a general efficiency problem; you have a micro-stopping and reduced speed problem.
Never compare OEE between different machines without context. A legacy press producing complex parts with 5-micron tolerances will naturally have a lower OEE than a new machine stamping simple brackets. Compare a machine only against its own historical baseline to measure the effectiveness of your continuous improvement efforts.
Integrating OEE With Lean and Quality Systems
OEE does not operate in isolation. Its real power emerges when integrated with established quality methodologies and lean manufacturing tools. In a facility producing electronic connectors, a machine registered an OEE of 58%, dragged down entirely by a quality rate of 88%.
We launched a Six Sigma DMAIC project targeting the scrap. Pareto analysis identified two specific defect modes causing 73% of the scrap. Correlation analysis linked the primary defect to fluctuations in barrel temperature. We installed a closed-loop thermal regulation system and implemented SPC charting on the temperature variable.
Integrating Methodologies for OEE Gains
OEE Function Alone
- Identifies the quality rate is 88%
- Highlights the specific machine dropping overall OEE
- Provides high-level scrap percentage data
- Flags the existence of a process issue
OEE + Six Sigma (DMAIC)
- DMAIC targets the specific defect via Pareto
- Correlation isolates temperature as root cause
- SPC controls the critical process parameter
- Quality rate rises to 97.5%, lifting total OEE
Within three months, the quality rate on that line increased from 88% to 97.5%. The overall OEE climbed from 58% to 72%. OEE pointed to the bleeding artery; Six Sigma provided the surgical instruments to fix it. Methodologies like SMED directly attack setup losses, while 5S eliminates the wasted motion causing minor stops.
OEE tells you exactly where your equipment is failing. It exposes the friction between your planned capacity and your physical reality. If your facility operates below 60% OEE, you have an immediate, untapped opportunity to increase output without capital expenditure. You simply need to stop ignoring the minor stops, the micro-delays, and the silent inefficiencies bleeding profit from your shifts.