A plant dashboard full of green checkmarks tells you what happened yesterday. It tells you nothing about what your process will yield tomorrow. I have audited plants where first pass yield hovered at 98%, yet the underlying statistical capability of the line was practically zero. The facility was not producing good parts consistently; it was simply getting lucky.
Being in specification is a lagging indicator. It confirms that a part has already passed inspection. Process capability is a leading indicator. It calculates the statistical probability of your process continuing to meet that specification under normal operating conditions. It answers the only question that matters: can your system actually deliver what you promised?
When organizations fail to understand this distinction, they attempt to solve engineering problems with operator discipline. They add inspection layers, write new work instructions, and hold daily defect huddles. None of these actions reduce the inherent variation built into the system. They simply add cost to a process that is already incapable.
The Statistical Reality of Capability Indices
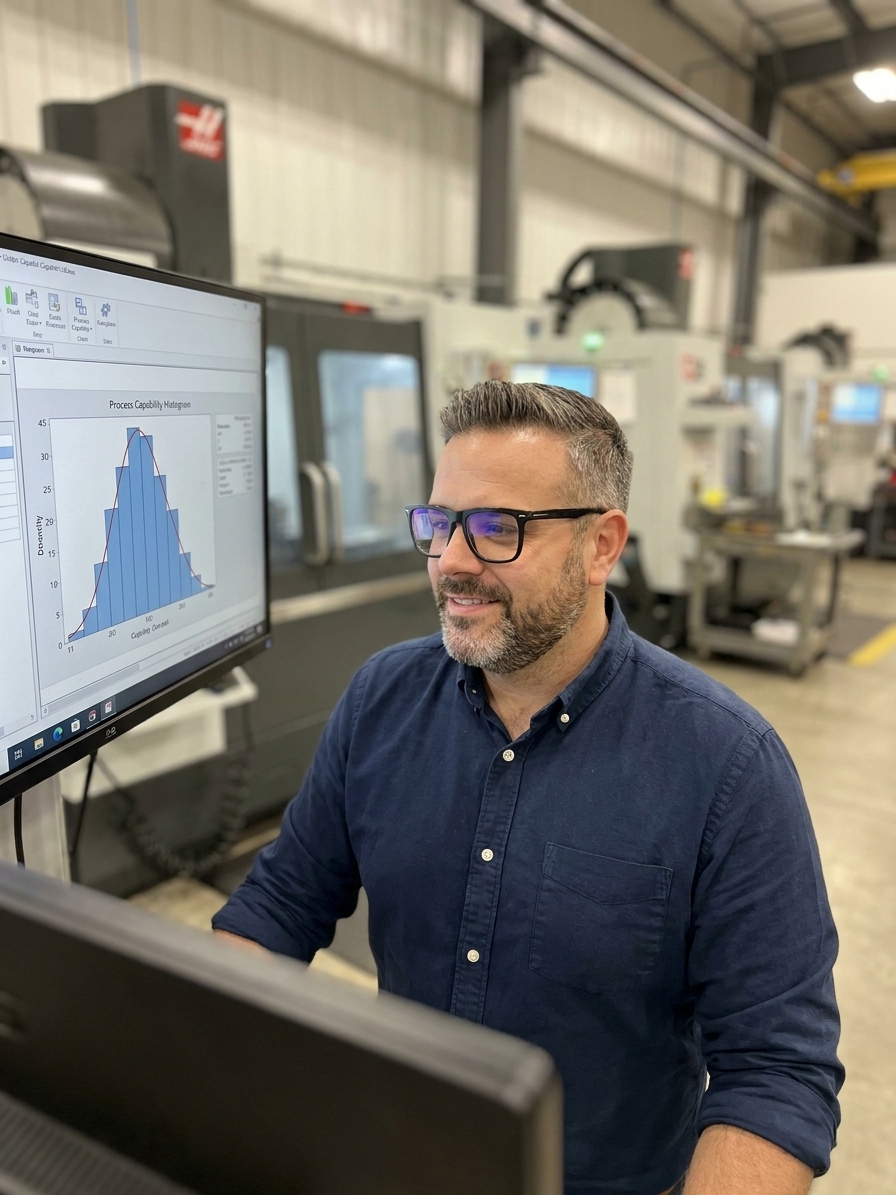
Process capability quantifies how much natural variation your process exhibits relative to your specification limits. The two primary indices are Cp and Cpk. Cp measures potential capability, assuming the process is perfectly centred between the tolerance limits. It is the simple ratio of your specification width to your process spread, defined as six standard deviations.
Cpk measures actual capability by factoring in process centring. If your process drifts toward the upper or lower specification limit, your Cpk will drop below your Cp. A Cpk of 1.0 means your process spread exactly fills your specification window. You are producing conforming product, but you have zero margin for error. Any shift in material, tooling, or ambient temperature will immediately push parts out of tolerance.
In automotive and aerospace quality management systems governed by IATF 16949 and AS9100, a Cpk of 1.33 is the traditional minimum threshold for critical characteristics. World-class manufacturers target 1.67 or higher. They design processes with enough statistical margin that normal degradation over time will not breach the specification.

Cpk Thresholds and Expected Defect Rates
Why Blaming Operators Destroys Quality
When a process lacks capability, organizations instinctively blame the people running it. Management adds inspection steps, writes more restrictive work instructions, and demands increased vigilance. This approach fundamentally misunderstands the source of variation. If your process capability index is below 1.0, no amount of human attentiveness will save you.
You cannot inspect quality into a product when the process that creates it cannot deliver the required dimensions. The variation is structural. It exists in the machine, the tooling, the material, or the environment. Holding an operator accountable for a systematic bias is poor management. It guarantees that the actual root cause remains unaddressed while the defect rate continues to fluctuate randomly.
I have seen medical device assembly lines where management deployed an extra inspector and increased sampling frequency to compensate for a low Cpk. They held daily huddles to discuss defect trends on that specific line. The actual solution was a worn tooling fixture introducing a systematic bias into the alignment step. Replacing a single fixture lifted the line from a Cpk of 0.93 to 1.52 in one shift, dropping the defect rate instantly.
Executing a Valid Capability Study
Calculating capability requires strict prerequisites. Skipping these steps invalidates the resulting indices. The first step is verifying your measurement system. Run a Gage R&R study. If your measurement system contributes more than 10% of the total observed variation, your capability indices are largely measuring measurement error, not process performance.
The second step is verifying statistical stability. Process capability assumes the data comes from a process in statistical control. Run a control chart on your data first. If you observe trends, shifts, or out-of-control points, your process suffers from special cause variation. Calculating Cpk on an unstable process yields a mathematically correct but entirely meaningless number.
Once stability and measurement adequacy are confirmed, collect your data. Use 50 to 100 consecutive individual measurements representing normal production conditions. The data must not be cherry-picked from a single optimal shift. Finally, check for normality. Standard capability calculations assume a normal distribution. If your process produces skewed data, apply appropriate transformations or non-normal capability methods to get an accurate index.
Process Capability Validation Sequence
- 01Verify Measurement SystemConduct Gage R&R to ensure variation comes from the part, not the gauge.
- 02Confirm Statistical StabilityUse control charts to prove the process is free of special cause variation.
- 03Collect Representative DataGather consecutive measurements under normal production conditions.
- 04Check Distribution NormalityApply tests like Anderson-Darling before using standard capability formulas.
- 05Calculate and Interpret IndicesCompare Cp and Cpk to identify spread issues versus centring issues.
Short-Term Snapshots Versus Long-Term Performance
Cpk is a short-term snapshot. It tells you how capable your process is right now, under tightly controlled conditions. It does not account for the variation that accumulates over weeks and months. Tool wear, material lot changes, operator differences, ambient conditions, and setup variations all introduce drift into your process over time.
Long-term capability is measured using the Process Performance Index, or Ppk. Ppk accounts for total observed variation over an extended production run. The relationship between short-term and long-term capability is commonly expressed as a 1.5 sigma shift. This rule of thumb suggests that long-term variation is approximately 1.5 standard deviations wider than short-term variation due to the accumulation of normal process noise.
Because of this 1.5 sigma shift, a short-term Cpk of 1.33 will degrade over time. In long-term production reality, it functions closer to a 1.0. This is exactly why elite manufacturers refuse to treat 1.33 as a target. It is the bare minimum. They design their machines and select their tooling to achieve a Cpk of 1.67 or higher, ensuring that normal degradation still leaves them safely within specification.
A Cpk of 1.33 is not a target. It is the absolute minimum required to ensure normal degradation does not breach your tolerances.
The Hidden Cost of Managing Incapable Processes
Organizations that ignore process capability pay for it in ways that rarely appear on a single cost report. Scrap and rework are the most visible penalties, but they are the smallest costs. The real damage happens in the invisible overhead created to manage the incapacity. This overhead includes 100% sorting, emergency containment, expedited freight, and customer visits to explain quality escapes.
I calculated the true cost of an incapable process at an automotive supplier facility. The direct scrap cost was significant, but it was overshadowed by the cost of coping mechanisms. The plant was spending nearly four times the scrap cost on extra inspectors, sorting operations, containment activities, and the management time required to coordinate the chaos. They were burning capital to manage a problem they refused to solve at its source.
Customer trust compounds this hidden cost. Customers do not see your dashboards. They see the occasional defect that slips through your containment. Each escape erodes their confidence until the next supplier audit is no longer a formality. It becomes a structured search for a replacement. Incapable processes destroy customer relationships faster than any pricing issue.
Integrating Capability Into Design and Production
World-class organizations do not use process capability as a reporting metric. They use it as a design tool. They do not wait until production to discover if a process can hold tolerance. During APQP and PPAP, they set minimum capability thresholds for the equipment and tooling before approving them for production. They design the margin directly into the system.
This requires making capability data highly visible. It cannot remain buried in a quality engineer’s spreadsheet. Post the Cpk values for critical characteristics directly at the line. Review them in daily production meetings alongside OEE and delivery metrics. When a process capability drops below 1.33, it triggers an immediate engineering response, not a reactionary inspection.
If your organization has not systematically evaluated capability, start immediately. Pick your top five critical characteristics and run valid capability studies. Rank them lowest to highest. Attack the bottom of the list first. Your lowest Cpk processes are your biggest operational risks, and addressing them typically yields the highest return on engineering investment.