Quality
and Signal Detection Theory: When Your Organization Discovers That Every
Inspection Is a Trade-Off Between Catching Defects and Creating False
Alarms — and the Alarm You Set to Protect Your Customer Becomes the
Noise That Paralyzes Your Production
The Night the Line Stopped
It was 2:47 AM on a Thursday when the quality manager’s phone rang.
The night shift had stopped Line 3. Again. Not because they found a
defect — because the automated vision system had flagged forty-seven
consecutive parts as non-conforming. The operator, following procedure,
halted production and called it in.
The quality manager drove to the plant in the dark, pulled up the
images, and within three minutes saw what the night crew couldn’t: the
vision system’s lighting had shifted by half a millimeter during a tool
change. The camera was now casting a shadow that the algorithm
interpreted as a surface defect. Every single one of those forty-seven
parts was perfect.
But the line had been down for ninety minutes. Three skilled
technicians had been pulled from other tasks. The customer shipment
would be late. And the cost of all this disruption — triggered by zero
actual defects — would appear in no metric, no dashboard, and no
management review.
This is the signal detection problem in quality. And most
organizations don’t even know it exists.
What Signal Detection
Theory Really Is
Signal Detection Theory was developed in the 1950s to help radar
operators distinguish enemy aircraft from noise. The fundamental insight
was simple but profound: any detection system — human or machine
— faces two kinds of errors, and you cannot eliminate both
simultaneously.
You can miss a real signal (a defect passes through undetected). Or
you can detect a signal that isn’t there (a good part gets flagged as
defective). These errors have names:
- Miss (Type II error): A defective part passes
inspection. The customer finds it. The consequences are external
failures, warranty claims, damaged reputation, potentially safety
incidents. - False Alarm (Type I error): A good part gets
rejected. The consequences are internal disruption, wasted material,
delayed shipments, operator frustration, and a quality system that cries
wolf so often that people stop listening.
Every inspection — every visual check, every automated gauge, every
X-ray scan, every human judgment on a production line — sits somewhere
on this spectrum. Set your threshold tight, and you catch more defects
but also generate more false alarms. Set it loose, and you reduce false
alarms but let more defects through.
The threshold is always a choice. And most organizations make
it without understanding they’re making it.
The Four Cells That
Explain Everything
Imagine a 2×2 matrix. On one axis: the true state of the part
(defective or good). On the other axis: the inspection decision (accept
or reject). This gives you four outcomes:
| Part Is Good | Part Is Defective | |
|---|---|---|
| Accept | Correct acceptance (True Negative) | Miss (False Negative) |
| Reject | False Alarm (False Positive) | Correct rejection (True Positive) |
Most quality metrics track only the bottom-right cell: correct
rejections. “We caught 99.2% of defects.” Congratulations. But what
happened in the other three cells? How many good parts did you throw
away to achieve that detection rate? How many defects slipped through
despite your best efforts? And what did all those false alarms cost you
in downtime, rework, and organizational trust?
The answers to those questions determine whether your quality system
is actually working — or just performing.
The Automotive Supplier
Who Cried Wolf
I once consulted for a Tier 1 automotive supplier that stamped body
panels. They had invested €2.3 million in a state-of-the-art inline
measurement system — laser-based, six-axis, capable of measuring 400
points per panel in under three seconds. The system was magnificent.
It was also generating false alarms on 12% of production. Twelve out
of every hundred panels — panels that met every specification — were
being diverted to a manual re-measurement station. Eighty percent of
those panels passed the manual check. The false alarm rate was
destroying the line’s throughput, consuming skilled inspectors’ time,
and creating a backlog that required Saturday shifts just to clear.
When I asked the quality engineer why the threshold was set so tight,
the answer was telling: “We had a customer escape two years ago. After
that, management said zero tolerance. So we set the limits to ±2σ
instead of ±3σ.”
This is the classic quality overreaction. A defect escapes.
Management panics. Thresholds tighten. False alarms explode. The cost of
the false alarms never gets compared to the cost of the original escape
— because the cost of false alarms is distributed, invisible, and
absorbed by production, while the cost of an escape is concentrated,
visible, and blamed on quality.
The real calculation would have looked like this: The original escape
cost approximately €180,000 in warranty and containment. The tightened
thresholds were costing approximately €94,000 per month in lost
throughput, manual re-measurement, and overtime. In fourteen months, the
cure had cost more than the disease — and was still running.
The
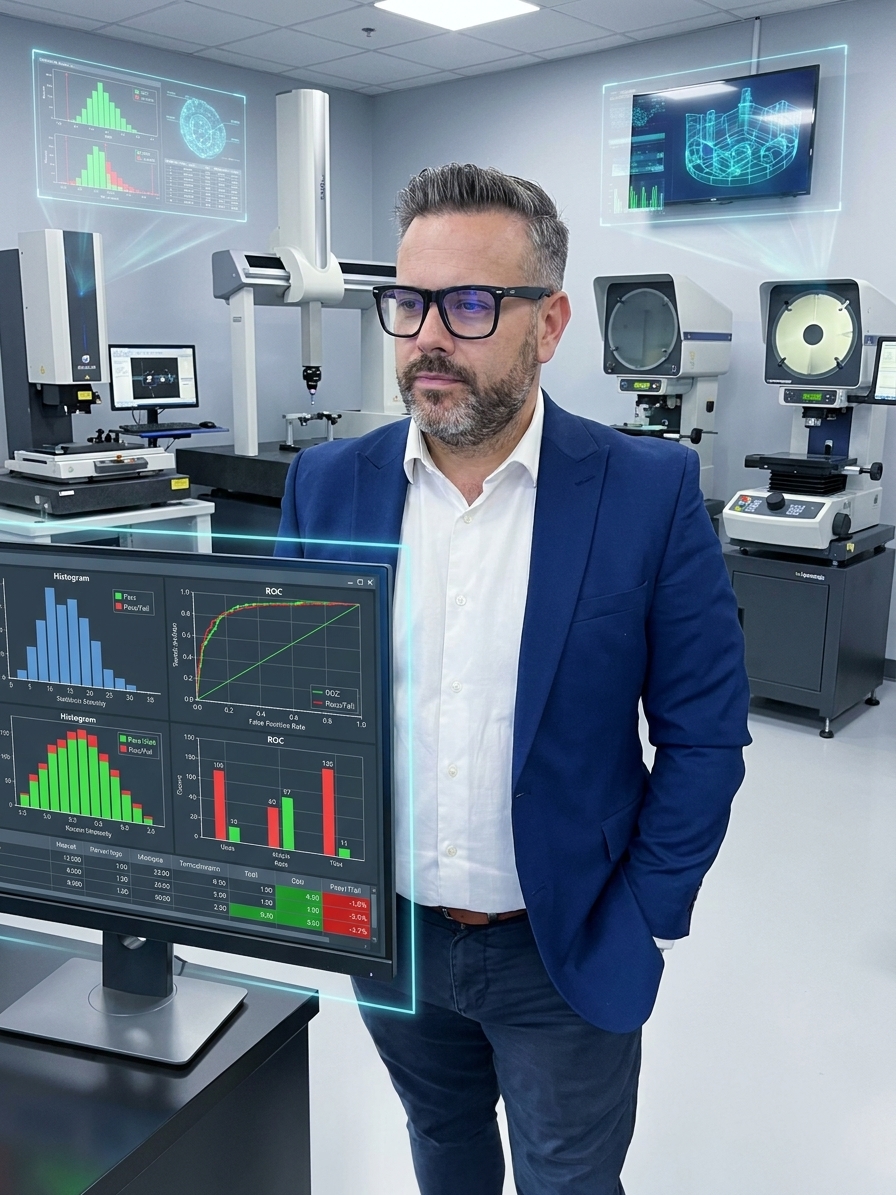
Receiver Operating Characteristic — Your Quality System’s Report
Card
In Signal Detection Theory, the relationship between hits (correctly
detected defects) and false alarms is visualized through a Receiver
Operating Characteristic curve — the ROC curve. It plots the probability
of detecting a real signal against the probability of a false alarm at
every possible threshold setting.
A perfect inspection system would hug the top-left corner: 100%
detection, 0% false alarms. A random system — one that just flips a coin
— follows the diagonal. Your actual inspection system lives
somewhere between these two extremes, and the shape of its ROC curve
tells you everything about its capability.
Here’s what most organizations never do: they never plot their own
ROC curve. They never systematically vary the inspection threshold and
measure both hit rates and false alarm rates across the full range. They
set a threshold based on intuition, fear, or historical precedent, and
then they live with the consequences without ever understanding the
trade-off they’ve made.
Doing an ROC analysis on your inspection systems — human or automated
— is one of the most revealing quality exercises you will ever conduct.
It shows you exactly where you are on the curve. It tells you whether
tightening the threshold will gain you meaningful detection or just
drown you in false alarms. And it gives you the data to have an
intelligent conversation about how much detection you actually need and
how much you’re willing to pay for it.
The Human
Inspector as a Signal Detection System
Every human inspector is a signal detection system with its own ROC
curve, and that curve shifts throughout the day based on fatigue,
motivation, expectation, and context.
Consider a visual inspector checking circuit boards for solder
defects. In the first hour of a shift, the inspector is fresh,
attentive, and likely to detect most real defects — but also likely to
flag ambiguous cases that are actually good. By hour six, fatigue has
set in. The inspector’s threshold has shifted. They’re now less likely
to flag borderline cases — which means fewer false alarms but also more
misses.
This isn’t negligence. It’s a fundamental property of human signal
detection. The brain adjusts its decision threshold based on the
perceived base rate of signals and the perceived cost of errors. If an
inspector sees 10,000 parts and only 3 are defective, the brain learns
that “defects are rare” and unconsciously raises the threshold for
declaring something defective. This is the same mechanism that makes it
dangerous to drive on an empty road at night — your brain stops
expecting hazards.
The implications for quality management are profound:
If your defect rate is very low, your inspector’s brain will
naturally become less sensitive to defects. This is not a
training issue. It is not a motivation issue. It is a neurobiological
reality. The solution is not to yell at inspectors or threaten them with
consequences. The solution is to engineer the detection task so that the
signal remains salient — through known-defect samples inserted into the
flow, through periodic task rotation, through augmented reality overlays
that highlight the specific features being inspected.
If your defect rate suddenly increases, your inspector’s
brain will initially miss more defects than it should because
the threshold is still calibrated to the old, lower rate. There is a
lag. The inspector needs time and evidence to recalibrate. During that
recalibration period, escapes increase. This is why sudden process
shifts are so dangerous — not just because they produce defects, but
because the human detection system is optimized for the old reality.
The Economics of the
Threshold
Here is the calculation that most organizations never make:
Cost of a miss = (Probability of escape) × (Cost per
escape) Cost of a false alarm = (Probability of false
rejection) × (Cost per false rejection)
The optimal threshold is the one that minimizes the total cost — not
the one that maximizes detection, not the one that minimizes false
alarms, and certainly not the one that feels safest.
In pharmaceutical manufacturing, the cost of a miss (a contaminated
batch reaching patients) is astronomical — potentially including product
recalls, lawsuits, regulatory sanctions, and loss of life. The cost of a
false alarm (rejecting a good batch) is significant but bounded — wasted
materials, retesting, delayed shipments. The optimal threshold skews
heavily toward sensitivity: catch everything, accept the false alarms,
because the cost of a miss is orders of magnitude higher.
In high-volume consumer electronics, the cost of a miss (a cosmetic
defect reaching the customer) might be a returned product worth €40. The
cost of a false alarm (rejecting a good unit, delaying shipment, losing
line throughput) might be €12 per unit multiplied by thousands of units.
The optimal threshold shifts toward specificity: tolerate some misses
because the cost of false alarms compounds faster.
The right answer depends on your economics. And most
organizations have never done the math.
Why
Your MSA Is Telling You About Signal Detection and You Don’t Realize
It
If you’ve ever conducted a Measurement System Analysis — specifically
an Attribute Gage R&R study — you have already collected signal
detection data. You just weren’t looking at it that way.
In a standard attribute MSA, multiple inspectors evaluate the same
set of parts multiple times. The parts include known good and known bad
samples. The analysis tells you how often inspectors agree with
themselves (repeatability) and with each other (reproducibility).
But hidden in that data is your inspection system’s ROC curve. Every
inspector, across their repeated trials, has a hit rate (how often they
correctly identified defective parts) and a false alarm rate (how often
they rejected good parts). Plot those two numbers for each inspector,
and you see their individual decision thresholds. Some inspectors are
conservative — they rarely flag anything, so they have low false alarms
but also low detection. Others are liberal — they flag everything,
catching most defects but generating a storm of false alarms.
The most common response to an attribute MSA that shows poor
agreement is “we need more training.” But often, the problem isn’t that
inspectors don’t know what a defect looks like. The problem is that
different inspectors have different thresholds for declaring something
defective — and no one has told them where the threshold should be.
Training doesn’t fix a threshold problem. Calibration
does. And calibration requires showing inspectors the
borderline cases, discussing them as a group, and agreeing collectively
on which side of the line each case falls. This is threshold alignment —
and it’s the most powerful thing you can do to improve attribute
inspection performance.
The Automation Trap
Organizations often believe that automating inspection solves the
signal detection problem. It doesn’t. It moves the problem from the
human brain to the algorithm — and then hides it behind a layer of
technical complexity that makes it even harder to see.
Every automated inspection system has a decision threshold. In
machine vision, it might be a sensitivity parameter on a defect
detection algorithm. In SPC, it’s the control limit width. In X-ray
inspection, it’s the contrast threshold for flagging voids. These
thresholds are set by engineers, often during commissioning, and then
forgotten.
The problem is that the optimal threshold changes over time. As the
process drifts, as tooling wears, as material lots vary, the
signal-to-noise ratio shifts. A threshold that was optimal in January
might be generating excessive false alarms by March — or missing defects
that have become more frequent.
The solution is not to set the threshold once and forget it.
The solution is to monitor the inspection system’s performance as a
signal detection system over time. Track both the hit rate and
the false alarm rate. When either one shifts, investigate. Adjust. The
threshold is a living parameter, not a set-and-forget setting.
The Quality Leader’s
Framework
If you’re responsible for inspection performance — whether it’s
human, automated, or hybrid — here is a practical framework drawn
directly from Signal Detection Theory:
1. Know your current operating point. What is your
hit rate? What is your false alarm rate? Most organizations know one but
not the other. You need both.
2. Estimate the real costs. What does a miss cost?
What does a false alarm cost? Be honest. Include the hidden costs — the
downtime, the frustration, the overtime, the erosion of trust in the
quality system.
3. Find the optimal threshold. The math is
straightforward. The optimal threshold minimizes total expected cost. It
will not eliminate either type of error. It will balance them
intelligently.
4. Align your team. If you have human inspectors,
calibrate their thresholds. Use borderline samples. Discuss them. Create
a shared understanding of where the line is.
5. Monitor and adapt. Thresholds are not permanent.
As your process changes, as your economics change, as your detection
technology improves, re-optimize.
6. Make the trade-off visible. Stop reporting only
detection rates. Report false alarm rates alongside them. When
management asks why you’re not catching more defects, show them the ROC
curve and ask how many false alarms they’re willing to pay for.
The
Deeper Insight: Quality Is Always a Decision Under Uncertainty
Signal Detection Theory reveals something fundamental about quality
that most frameworks miss: quality inspection is never about
certainty. It is always about making decisions under uncertainty, and
every such decision carries the risk of being wrong in two
directions.
This is why zero-defect thinking, while aspirational, can be
dangerous when it’s interpreted as “reject everything suspicious.” The
pursuit of zero defects delivered to the customer is noble. The pursuit
of zero risk in the inspection process is a mathematical impossibility
that, when attempted, creates a different kind of failure — the failure
of a quality system so noisy that it cannot distinguish real problems
from phantom ones.
The mature quality organization doesn’t chase zero false alarms or
zero misses. It understands the trade-off. It quantifies both sides. It
makes a deliberate, economic, informed choice about where to set the
threshold. And it revisits that choice regularly, with data, in the full
knowledge that perfection is not an option — but intelligent
optimization always is.
The next time your line stops for a false alarm, don’t just restart
it and move on. Ask: what is our threshold? Where are we on the ROC
curve? And is this the right place to be — or just the place we ended up
by accident?
The answer might be the most important quality insight your
organization has never had.
Peter Stasko is a Quality Architect with 25+ years
of experience transforming organizations across automotive, aerospace,
and pharmaceutical industries. He specializes in making the invisible
dynamics of quality systems visible — and actionable.