Quality
and the Illusion of Control: When Your Organization’s Confidence in Its
Process Is the Strongest Signal That the Process Is Running It
The Dashboard That Lied
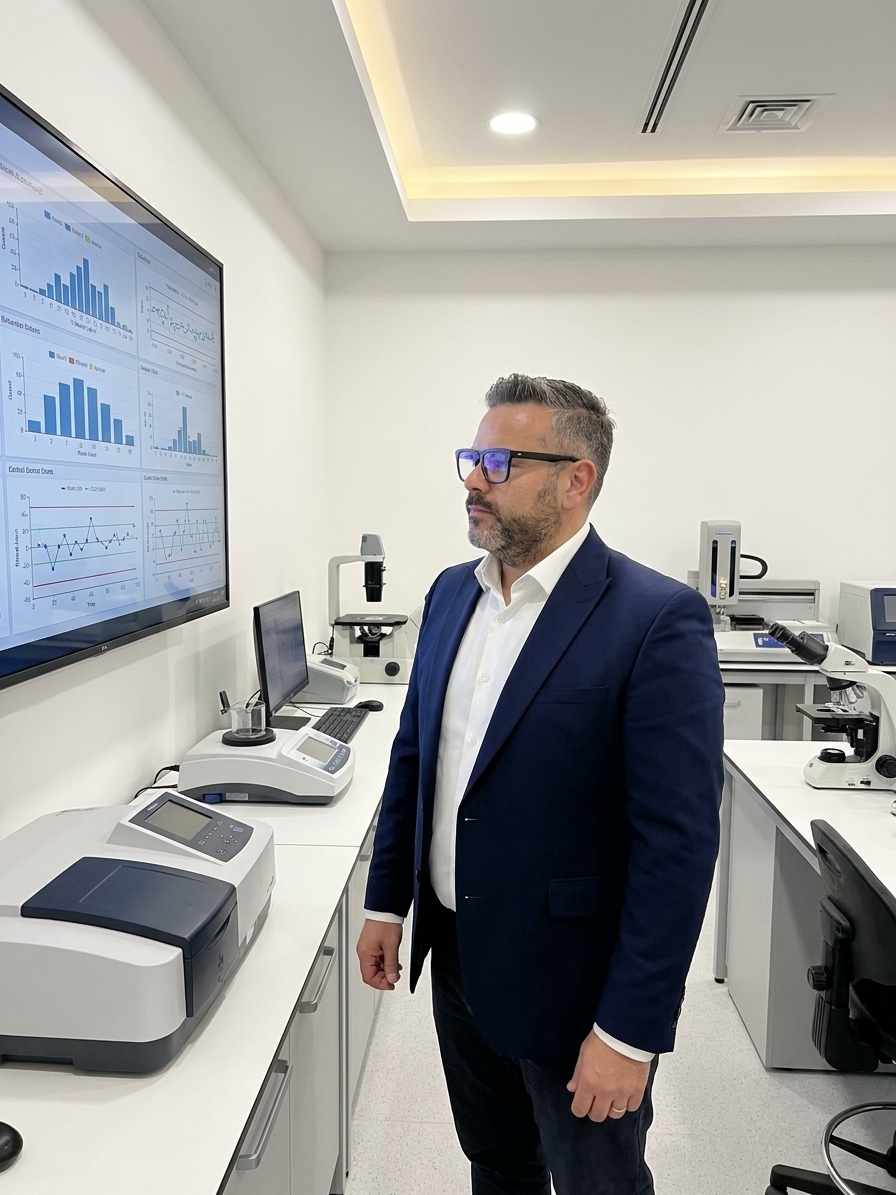
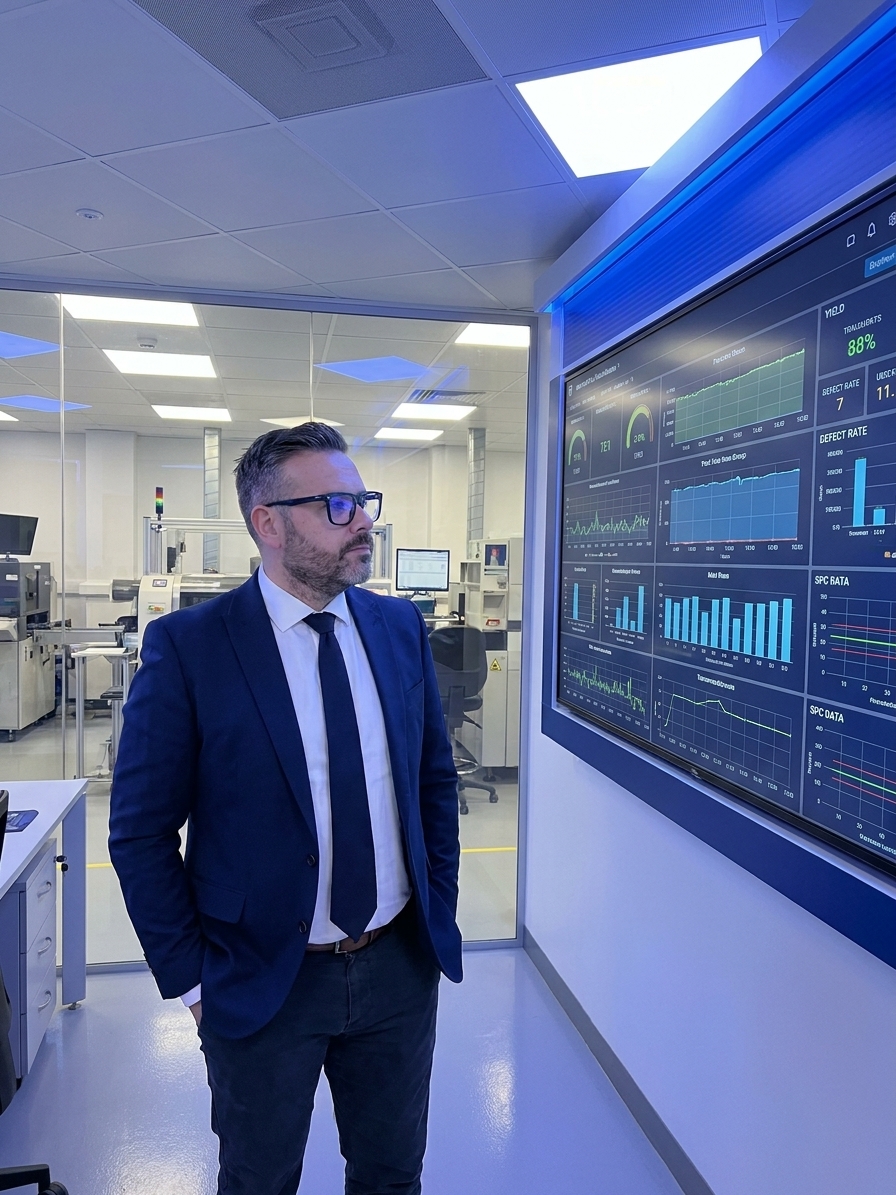
The plant manager studied the wall of monitors with quiet
satisfaction. Every line green. Every metric within specification. Every
process parameter exactly where it should be. He turned to the visiting
auditor and said, with the calm authority of someone who has seen it
all, “We have complete control over our quality. Complete.”
Three weeks later, a customer returned 14,000 parts. The root cause
was a temperature sensor that had been reading 3.7 degrees low for six
months. The control charts had looked perfect. The process appeared
stable. The dashboards glowed green. But the process had been drifting —
slowly, invisibly, inevitably — and nobody noticed because the system
they trusted to detect drift was itself the thing that had drifted.
The plant manager didn’t lack data. He lacked the ability to
distinguish between measuring a process and controlling it. That
distinction is the Illusion of Control, and it is quietly undermining
quality systems in organizations that believe they are managing risk
when they are actually decorating it.
What the Illusion of
Control Really Is
The Illusion of Control is a cognitive bias first identified by
psychologist Ellen Langer in 1975. It describes the tendency for people
to overestimate their ability to influence outcomes that are actually
determined by chance, complexity, or forces beyond their control. In a
casino, it’s the gambler who believes that rolling the dice a certain
way improves the odds. In quality management, it’s the engineer who
believes that because a process has a control chart, the process is
under control.
The bias operates through several mechanisms:
Confusing measurement with management. The mere act
of tracking something creates a feeling of control. You install a
sensor. You plot the data. You review the chart. Each step feels like an
act of mastery. But measurement is observation, not intervention. A
thermometer does not control the weather. A control chart does not
control the process. It merely describes what the process did after the
fact.
Confusing correlation with causation. When two
things move together — a parameter adjustment and a reduction in defects
— the human brain constructs a causal story. “We adjusted the
temperature and defects dropped.” Perhaps. Or perhaps defects dropped
for a reason you didn’t measure, and the temperature change was
coincidental. The Illusion of Control feeds on these stories.
Confusing effort with influence. Organizations that
work hard at quality — meetings, reviews, audits, corrective actions —
develop a deep sense that their effort must be producing results. And
often it is. But the sense of control extends beyond what the effort
actually achieves. The weekly quality review meeting feels like control.
The 47-page procedure feels like control. The sophisticated statistical
software feels like control. Feelings are not data.
Confusing past success with future reliability.
“We’ve never had a problem with this process” becomes, in the mind of
the organization, “this process cannot fail.” Survival becomes evidence
of robustness rather than evidence of luck. And the longer a process
runs without incident, the more the Illusion of Control hardens into
institutional certainty.
Where It Hides in Quality
Systems
The Illusion of Control doesn’t announce itself. It doesn’t show up
in audit findings or nonconformance reports. It hides in the spaces
between the things you measure and the things you don’t, in the gap
between the process you describe and the process that actually runs.
In statistical process control. SPC is one of the
most powerful tools in quality management. It is also one of the most
commonly misapplied. Organizations plot control charts, calculate
control limits, and then behave as though being “in control” means the
process is producing good parts. But control limits describe statistical
behavior, not fitness for use. A process can be perfectly stable and
perfectly wrong — stable at the wrong target, stable with too much
variation, stable while the measurement system itself drifts. The chart
says “in control.” The organization reads “under control.” These are not
the same thing.
In risk management. FMEA teams sit in conference
rooms and assign severity, occurrence, and detection ratings to failure
modes with a precision that implies knowledge. But the ratings are
estimates — often influenced by the most confident voice in the room, or
by the desire to produce a risk priority number that falls below the
action threshold. The completed FMEA looks like control. It feels like
control. It may even be a useful exercise. But the risk you failed to
imagine doesn’t appear on the form, and the confidence you feel in the
ratings may exceed the evidence that supports them.
In supplier management. “We audit our suppliers
annually.” This sentence is supposed to communicate control. But what it
often communicates is that once a year, for two days, a team of auditors
visits a supplier facility, reviews documentation, interviews carefully
prepared personnel, and leaves with a report that looks thorough. The
other 363 days are invisible. The Illusion of Control convinces the
organization that the audit snapshot represents the supplier’s ongoing
capability. It rarely does.
In corrective and preventive action. A defect
occurs. An investigation is launched. A root cause is identified. A
corrective action is implemented. The defect rate drops. The CAPA is
closed. The organization moves on, satisfied that it has demonstrated
control. But did the corrective action fix the cause, or did the cause
fix itself? Did the defect rate drop because of the action, or because
the conditions that produced the defect changed independently? The
timeline creates a narrative. The narrative creates an illusion.
In automated systems. Automation is the Illusion of
Control’s greatest ally. When a machine sorts parts, when a robot
applies torque, when a vision system inspects welds, the human tendency
is to assume that the automation is reliable, consistent, and correct.
But automated systems fail in ways that are invisible until they become
catastrophic. They fail silently, consistently, and at scale. The
automated inspection system that rejects good parts and accepts bad ones
doesn’t look broken — it looks like it’s working. It produces data. The
data looks like control.
The Hidden Cost
The most dangerous thing about the Illusion of Control is not that it
makes you wrong. It’s that it makes you confident while you’re
wrong.
Organizations under its influence invest in monitoring when they
should invest in understanding. They add dashboards when they should add
skepticism. They build elaborate systems of measurement and review that
create an architecture of reassurance — a cathedral of data that feels
like control but functions as comfort.
The hidden cost is not the monitoring itself. Monitoring is valuable.
The hidden cost is what the monitoring replaces: the habit of
questioning, the discipline of doubt, the willingness to look beyond the
dashboard and ask whether the things you’re measuring are the things
that matter.
Consider the organization that measures 200 process parameters in
real time but has never validated whether those 200 parameters are the
ones that actually drive product quality. The monitoring system
generates thousands of data points per hour. Every operator, every
supervisor, every manager can see the numbers. The abundance of
information creates a feeling of comprehensive control. But if the
critical parameter — the one that actually determines whether the
product works — is parameter 201, the one you didn’t think to measure,
then all 200 green lights on the dashboard are performing an elaborate
pantomime of quality.
Or consider the organization that has invested heavily in a quality
management system — procedures, work instructions, training records,
audit schedules, management reviews — and equates the existence of the
system with the effectiveness of the system. The procedures are
followed. The records are complete. The audits are passed. Everything
looks controlled. But the procedures were written five years ago for a
process that has since been modified three times. The training records
show attendance, not comprehension. The audits confirm compliance, not
performance. The system generates evidence of control without generating
control itself.
The Plant That Believed
Its Own Story
A pharmaceutical manufacturer had invested millions in process
analytical technology. Inline sensors measured critical quality
attributes in real time. Advanced algorithms detected trends before they
became excursions. The system had been validated, qualified, and
celebrated in industry conferences.
One Tuesday morning, a batch failed dissolution testing. Then
another. Then three more. Investigation revealed that a cleaning solvent
residue had been accumulating on a sensor lens for weeks. The sensor
hadn’t failed — it had gradually shifted its baseline. The algorithm,
trained on the sensor’s output, had adapted to the drift. Everything
looked normal because “normal” had been slowly redefined by the very
system that was supposed to detect abnormality.
The organization had extraordinary measurement capability. What it
lacked was the habit of periodically questioning whether its
measurements were still measuring reality. The system provided so much
data, so consistently, with such apparent precision, that the
possibility of the system itself being compromised had become literally
unthinkable.
That is the Illusion of Control at full strength. Not the absence of
systems, but the presence of systems so impressive that their
limitations become invisible.
How to Break the Spell
Overcoming the Illusion of Control is not about abandoning
measurement, discarding procedures, or dismantling quality systems. It
is about maintaining a productive relationship with uncertainty — a
relationship where the systems you build are subject to the same
scrutiny you apply to the processes they monitor.
Distinguish between observation and intervention.
Every time you review a dashboard, ask: “What am I observing, and what
am I actually controlling?” If the answer to the second question is
“nothing,” then the dashboard is a window, not a steering wheel. Windows
are useful. But confusing a window for a steering wheel gets you into
accidents.
Challenge your measurement system, not just your
process. Measurement System Analysis should not be a one-time
event. If you don’t periodically verify that your measurement systems
are still accurate, you are building conclusions on a foundation that
may have shifted. The thermometer on the wall of a greenhouse doesn’t
control the temperature. And if the thermometer is wrong, neither you
nor the plants know the truth.
Look for what you’re not measuring. The most
important quality parameters in any process are often the ones nobody
thought to track. Periodically — perhaps annually, perhaps during
management review — ask the question: “What could be affecting our
product quality that we are not currently monitoring?” The answers will
be uncomfortable. They should be.
Doubt your root causes. When you complete a
corrective action and the problem goes away, resist the temptation to
close the file and celebrate. Ask: “How do we know our action caused the
improvement? What else changed during the same period? If we reversed
our action, would the problem return?” The answers to these questions
are often humbling. Humility is a quality tool.
Automate with suspicion. Every automated system
should have a manual verification method — a way to check,
independently, whether the automation is still performing correctly.
This is not redundant. This is the difference between trusting a system
and depending on it.
Separate the feeling of control from the fact of
control. When you feel most confident about a process — when
the charts are green, the audits are passed, the metrics are trending in
the right direction — that is precisely the moment to ask the hardest
questions. Confidence is not evidence. Comfort is not control. The
process that feels most under control is often the one that has simply
been lucky long enough for luck to feel like mastery.
Seek disconfirming evidence. The Illusion of Control
feeds on confirmation. Every green data point, every passed audit, every
clean inspection reinforces the feeling that everything is under
control. Actively look for the data point that doesn’t fit, the audit
finding that surprises you, the inspection result that contradicts the
trend. These are not threats to your quality system. They are the only
things keeping it honest.
A Different Kind of
Confidence
There is a kind of confidence worth having in quality management. It
is not the confidence of the plant manager studying his green
dashboards. It is the confidence of the engineer who knows what her
process can do, knows what it cannot do, knows what she is measuring and
what she is not, and wakes up every morning with the productive anxiety
of someone who understands that control is not a state but an activity —
something you do, not something you have.
This engineer uses SPC not as proof of control but as a tool for
detecting its absence. She uses FMEA not as a catalog of known risks but
as a reminder that the most dangerous risks are the ones that didn’t
make the list. She audits suppliers not to confirm their quality but to
discover whether her assessment of their quality is still accurate.
She is not less confident than the plant manager. She is differently
confident. Her confidence is earned through the discipline of doubt, not
the accumulation of reassurance.
The Illusion of Control tells organizations that they have less to
worry about than they think. Reality tells them they have more. The
organizations that thrive are the ones that can hold both truths at the
same time: that their systems are good, and that their systems are not
enough. That their measurements are useful, and that their measurements
are incomplete. That they have done excellent work, and that excellence
requires them to keep questioning whether the work is still
excellent.
That is not paranoia. That is quality.
Peter Stasko is a Quality Architect with 25+ years
of experience transforming organizations across automotive, aerospace,
and pharmaceutical industries. He specializes in helping leadership
teams see the gaps between what their quality systems report and what
their processes actually deliver — because the most dangerous defects
are the ones your system was designed not to detect.