
Organisations routinely launch Quality Circle programmes by celebrating the wrong data. They track meeting frequency, count the number of active circles, and photograph operators gathered around whiteboards. These are input metrics. They measure activity, not capability. A plant can sustain a hundred meeting cadences and still produce zero implemented countermeasures.
Across two decades implementing ISO 9001 and AS9100 systems in automotive and aerospace, I have reviewed circle programmes that reported flawless participation rates alongside rising defect costs. The disconnect is predictable. When you measure enthusiasm, the system optimises for the appearance of engagement rather than the resolution of process failures.
The metrics that determine whether a programme survives past the first quarter are implementation lead time, solution sustainability, and the rate at which circle outputs enter the formal quality management system. These are output metrics. They tell you whether the mechanism is generating engineering value or merely consuming shift time.
The Management Commitment Threshold
Before measuring circle performance, measure the management response time. The single most predictive metric for programme survival is the number of days between a circle presenting a technically valid countermeasure and that countermeasure being implemented on the floor. If this lead time exceeds thirty days, voluntary participation will collapse before the second cycle begins.
I have audited facilities where operators produced rigorous 5-Why analyses only to find their recommendations buried in a supervisor's inbox for six months. The circles were functioning. The management gate was not. The problem was invisible because no one was tracking the implementation lead time. The programme appeared active on paper while dying in reality.
Define the threshold in a signed charter before recruiting a single volunteer: proposed countermeasures reviewed within ten working days, implemented within thirty. This is a measurable management obligation, not an aspiration. If the plant manager will not commit to a documented timebox, the programme has no foundation. Recording this metric monthly is the only way to detect the silent failure mode where circles generate solutions that never reach the process.
Facilitator Competency as a Leading Indicator
Facilitator quality determines whether circle data is structurally sound or fundamentally misleading. A poorly facilitated circle produces 5-Why chains that stop at operator error and Ishikawa diagrams that cluster every cause under machinery. This is bad data presented with confidence. It looks like problem-solving. It is actually symptom-relabelling.
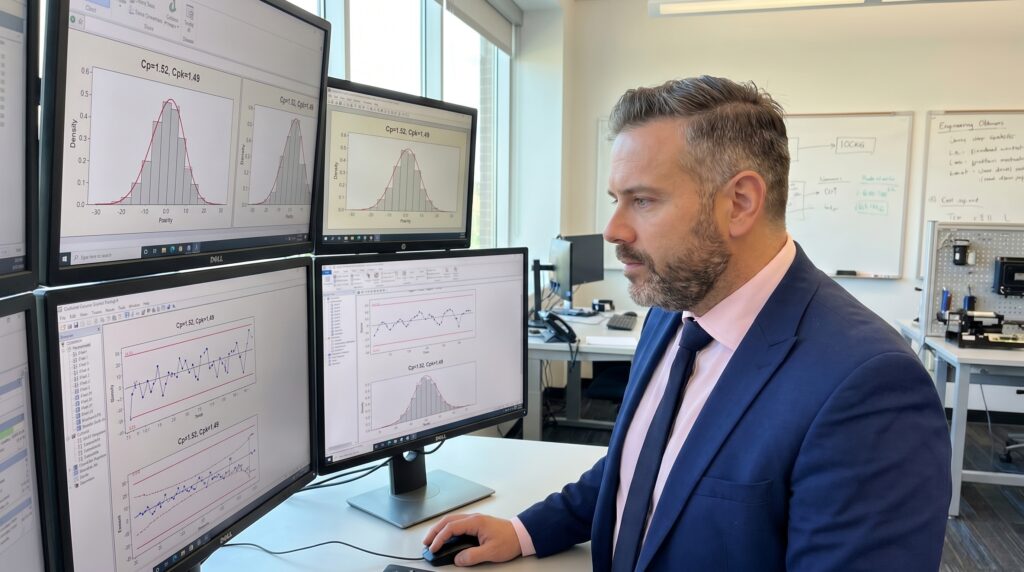
The VDA 6.3 process audit explicitly evaluates whether employees understand the quality tools relevant to their work areas. Apply the same standard to your facilitators. Do not verify competence through written tests. Hand the facilitator a box of rejected parts, give them a whiteboard, and time how long it takes them to guide a group from a documented defect to a statistically sound root cause.
The competency metric is binary and behavioural: can the facilitator restrain themselves from solving the problem for the group? If the facilitator writes the root cause on the board, they have failed the test. The facilitator guides the process; the circle members provide the content derived from their daily process knowledge. If the facilitator cannot pass a practical verification using real scrap data from their own line, they are not qualified to lead a pilot.
Programme Health Indicators
Measuring the Quality of Root Cause Data
The data a circle generates must be evaluated against a quality standard, not merely collected. A 5-Why chain that ends at operator training is not a root cause; it is a symptom restatement. A Pareto chart built from defect codes that the ERP system auto-generates tells you what the system categorised, not what the operators observed on the line.
Audit the circle's data packet before it reaches management. The check sheets should reflect direct measurement of the actual process, not a download from the quality database. A strong circle investigation contains stratified data: defects broken down by shift, by machine, by material lot, by operator. If the data has no stratification dimension, the circle has not yet found the boundary conditions of the failure mode.
This is where most programmes generate misleading signals. A circle presents a confident analysis based on aggregated monthly scrap data. Management approves a countermeasure. The defect persists because the aggregation hid the real variable. The programme takes the blame for a failure that originated in data collection methodology, not in the circle concept itself.
What the First Presentation Cycle Reveals
The first management presentation is a diagnostic event, not just a milestone. Watch how management receives the data. If the plant manager has not reviewed the packet beforehand, the commitment contract is void. If the technical discussion skips the root cause analysis and jumps straight to whether the countermeasure is affordable, the programme is being treated as a suggestion box, not an engineering process.
A circle dies not with a bang, but with an unanswered email and an empty meeting room.
Record what happens in the first three presentations. Does management make a resource allocation decision on the spot, or defer to a later meeting? Deferral is the metric that predicts programme death. It signals to the floor that the work is low priority. Track the deferral rate. If it exceeds thirty percent of presentations, the bottleneck is not circle competency. It is management follow-through, and no amount of additional operator training will fix it.
The speed of the first implementation sets the programme's credibility ceiling. If the first countermeasure is live within thirty days, the message reaches every shift that the process works. If implementation stretches to ninety days, expect voluntary participation to halve in the next cycle. The data trail is unambiguous in every programme I have evaluated.
Integration Metrics: From Tacit Knowledge to Controlled Documents
A circle solution that does not enter the formal QMS is an operational anecdote. The integration metric tracks the percentage of circle outputs that become revised controlled documents. Specifically: updated PFMEA entries, revised control plan parameters, new work instructions, and closed 8D or CAPA records. This is where circle work meets ISO 9001:2015 requirements for organisational knowledge.
When an operator identifies a previously undocumented failure mode during a circle investigation, the metric that matters is whether that knowledge moves from an individual's experience into the formal management system. The tacit must become explicit. Track the conversion rate. If circles are generating root cause analyses that never surface in a PFMEA revision, the organisation will repeat the same failure on a different shift.
Circle Output to QMS Integration Sequence
- 01Problem SelectionCircle defines the issue from shop-floor experience and visible waste
- 02Stratified Data CollectionDirect measurement using check sheets, broken down by shift, machine, and lot
- 03Root Cause AnalysisIshikawa and 5-Why applied past visible symptoms to underlying process variables
- 04Countermeasure TestingSolutions designed and verified within the circle's defined authority scope
- 058D and PFMEA IntegrationStandardised into controlled documents, work instructions, and CAPA records
In facilities with connected infrastructure, circles can access live SPC data, pull machine performance trends, and assess OEE impacts before presenting their analysis. This digital capability scales the circle's analytical reach. But the integration metric remains the same: does the analysis end up in the controlled documentation that governs the process? If not, the digital tools have merely produced a more sophisticated form of unreferenced data.
Scaling Metrics: When the Data Permits Expansion
Scale only when the pilot data proves the mechanism works. The criteria are not subjective. At least one pilot circle must have completed a full cycle: problem selection through data collection, root cause analysis, countermeasure implementation, and QMS integration. The sustained solution rate for that countermeasure must hold at the six-month audit point.
Expanding to additional areas requires replicating the gate sequence with the same metric discipline. Each new area needs a trained facilitator who passed practical competency verification, a management team that signed the commitment contract, and a baseline measurement of implementation lead time. Announcing new circles without these foundations guarantees the same failure mode the pilot was designed to prevent.
The ultimate scaling metric is the voluntary participation trend. Growing participation indicates the programme delivers value to the people doing the work. Declining participation is a structural warning that no management directive can override. If the voluntary flow stops, return to the commitment contract and audit the implementation lead time data. The breakdown is almost always in the management gate, not on the shop floor.
Track the participation trend monthly against the implementation rate. If participation drops while implementation holds above seventy percent, investigate facilitator burnout. If participation drops alongside declining implementation rates, the root cause is management follow-through. The data tells you exactly where the system is breaking. You simply have to measure the variables that matter rather than the ones that look good in a quarterly review.