Monthly quality reviews follow a predictable, ineffective pattern. A management team sits in a conference room reviewing spreadsheets tracking IATF 16949 conformance, Cpk trends, and scrap rates. Someone asks about a cost-of-quality spike on Line 3. The quality manager assigns an action item to investigate. The meeting adjourns, and the actual process generating the non-conformances remains unexamined.
This is the operational pathology of modern quality management. We aggregate defect data into digital dashboards and mistake the summary for the system. The distance between the decision-maker and the production floor is the exact distance between the quality system's theoretical design and its daily reality.
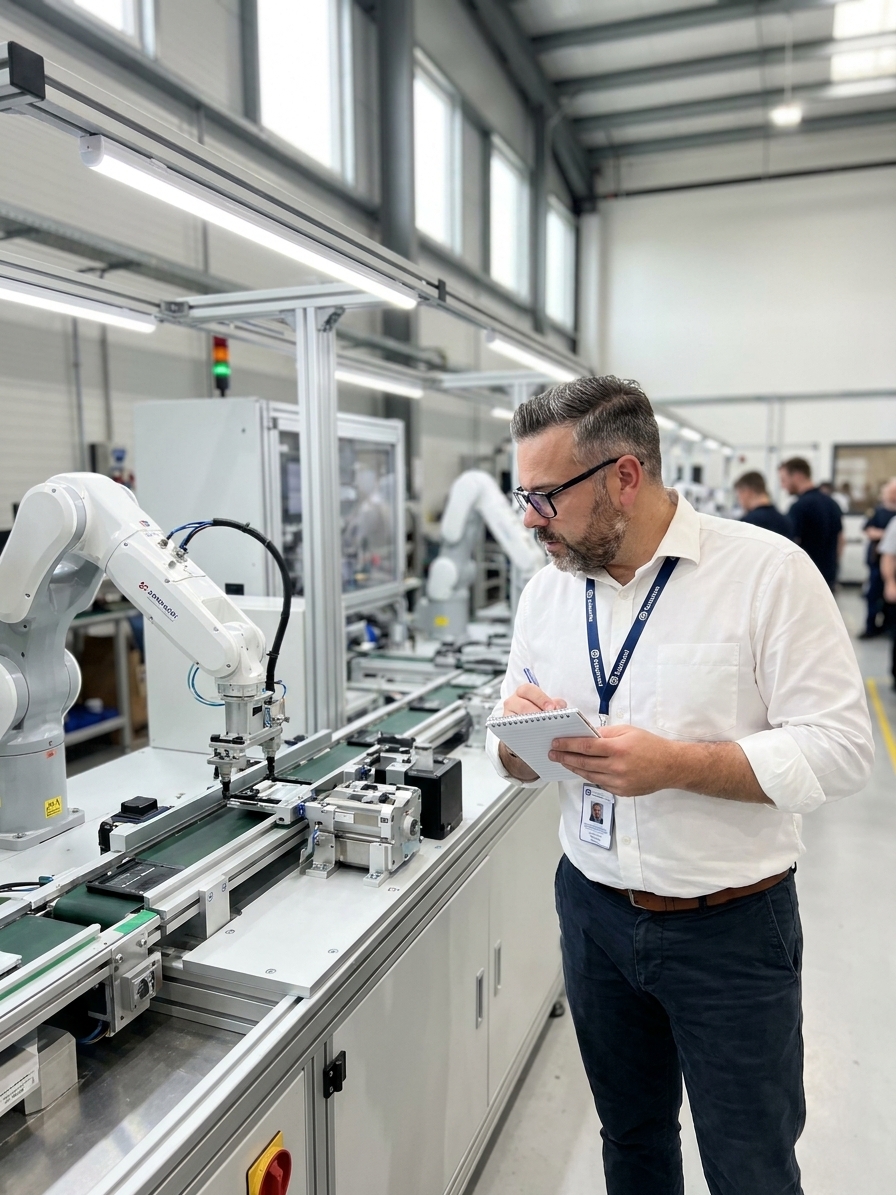
I have audited plants where the 8D investigation never once included a visit to the machine where the failure occurred. The Gemba Walk is the mechanism that closes this gap. It forces technical leaders into physical contact with the value-creating work, demanding the observation of real conditions rather than the review of filtered metrics.
The Operational Context Missing From SPC Charts
Your SPC charts and automated reports are rarely factually wrong, but they are structurally incomplete. Data tells you what happened; direct observation tells you why. When a process drifts, the aggregated data flags the deviation, but it strips away the exact environmental variables required to identify the true root cause.
Consider a robotic weld cell showing a sudden increase in porosity. The Pareto chart triggers an 8D. Engineering reviews the PLC parameters—amperage, voltage, travel speed—and finds everything within specification. Material certifications are pulled. Shielding gas mixtures are verified. The defect rate remains elevated while the investigation stalls.
A fifteen-minute observation on the floor reveals the actual mechanism. The shielding gas nozzle is partially blocked by spatter buildup. The operator has no standard work or allocated time to clear it during the shift. The blockage disrupts gas coverage, causing oxidation. This physical failure mode is entirely invisible to the data architecture feeding the management dashboard.

Avoiding the Audit and Solution Delivery Traps
Most organizations fail at Gemba Walks because they structurally sabotage the practice before it yields results. The most common failure mode is the audit disguised as observation. A manager arrives with a clipboard to verify procedural compliance. Operators immediately recognize the inspection dynamic, hide their deviations, and perform for the auditor rather than executing normal work.
The second failure mode is the solution delivery system. A manager observes an inefficiency and immediately dictates a fix, prescribing changes to station layout or tooling. This teaches the production team that their role is to listen, not to analyse. It prevents the collaborative root cause analysis required for sustainable process control.
The third failure is the drive-by. A supervisor walks the perimeter, glances at the andon boards, nods at operators, and returns to their desk. They check a box indicating a floor walk occurred. This approach yields zero context, captures no variation, and changes nothing about the quality system's effectiveness.
Execution Patterns for Floor Walks
What auditors do
- Carry checklists to verify procedural compliance
- Dictate immediate fixes based on outside assumptions
- Glance at stations and track shift-level metrics
- Treat operators as subjects of inspection
What effective leaders do
- Observe normal workflow without evaluating compliance
- Ask open questions to trigger operator-led analysis
- Stand still long enough to see hidden workarounds
- Treat operators as the primary source of process data
Structuring the Walk: From Material to Handoff
Effective Gemba Walks require deliberate structure. Enter the work area without interrupting the shift. Stand where the operator stands to experience the actual lighting, noise, and physical constraints of the station. Watch the process rhythm for at least fifteen minutes before asking a single question. This allows your eyes to adjust to the micro-stops and improvisations that operators smooth out automatically.
Target the workarounds specifically. Look for the tape holding a fixture together or the wedge propping up a gauge. Look for the redundant 100% inspection added after a customer complaint that was never removed. These physical adaptations are artifacts of a PFMEA that failed to capture reality.
Follow the material flow across the entire value stream, not just one cell. Observe the handoffs between departments. Watch where work-in-progress waits, and observe where components are moved and retrieved. Every transfer point is an opportunity for misidentification, damage, or information loss that standard routing sheets do not capture.
Sequence for a Structured Floor Observation
- 01Locate the physical realityStand at the exact station where the defect data originates, not in the adjacent office.
- 02Observe before speakingWatch the operation for at least fifteen minutes to identify micro-stops and informal fixes.
- 03Target the workaroundsIdentify physical modifications or deviations from standard work instructions.
- 04Track the material flowFollow the component to the next department to observe transfer and handling risks.
- 05Document the contextRecord specific physical observations that explain the numerical SPC deviations.
Integrating Observation With Quality Metrics
When engineering and quality leaders regularly walk the floor, isolated data points gain mechanical explanations. A scatter plot showing random diameter variation suddenly resolves into a clear pattern once you see how the operator loads the part into the fixture. A trend of inexplicable scrap becomes obvious once you observe the informal handoff process during the shift change.
Data without physical context is just noise. The Gemba Walk provides the qualitative framework required to interpret the quantitative rigour of your Cpk and OEE metrics. This is why Toyota mandated that executives spend significant time on the production floor despite having the most advanced data systems of the era. The dashboard tells you where to look; the floor tells you what you are actually looking at.
Every layer of abstraction in a report is a filter that removes the exact context needed to fix the problem.
Sustaining the Discipline and Closing the Loop
Starting floor walks is easy; sustaining them requires system integration. Most organizations abandon the practice within three months as urgent production issues crowd out the scheduled observation time. The facilities that sustain it treat the walk as a non-negotiable constraint, scheduling it directly into the production calendar alongside shift handovers and Tier 1 meetings.
Cross-functional participation prevents isolated observations. A quality engineer, a maintenance technician, and a production supervisor walking the line together create a shared understanding that email chains and 8D reports cannot replicate. When the maintenance tech sees the operator fighting a worn fixture in real time, the repair priority shifts immediately.
Closing the feedback loop is the most critical sustainability mechanism. When an operator shares an observation about a misaligned sensor, follow up within the week. Even if the resolution is simply logging a maintenance work order, the follow-up proves the observation mattered. Without this loop, operators learn that floor walks are performative, and the flow of accurate process data stops entirely.
The Operational Discomfort of Unfiltered Reality
Direct floor observation is intellectually uncomfortable for technical leaders. When you walk the floor with open eyes, you see the gap between your ISO 9001 documentation and the physical reality of the plant. You see the operator compensating for a design flaw, the ignored calibration sticker, and the worn tooling that was repeatedly flagged but never replaced due to OEE targets.
This discomfort is the primary mechanism for improvement. A robust quality system relies on confronting these realities directly, not insulating management behind filtered dashboards. Taiichi Ohno drew a chalk circle on the floor and forced managers to stand in it for hours precisely because passive observation is the hardest discipline for action-oriented engineers to master.
The floor is the ultimate source of quality data. Stop analysing the abstract representations of work and start observing the physical processes that actually generate your conformances and your defects. Improvement only becomes possible when the management team accepts the operational reality visible right in front of the machine.