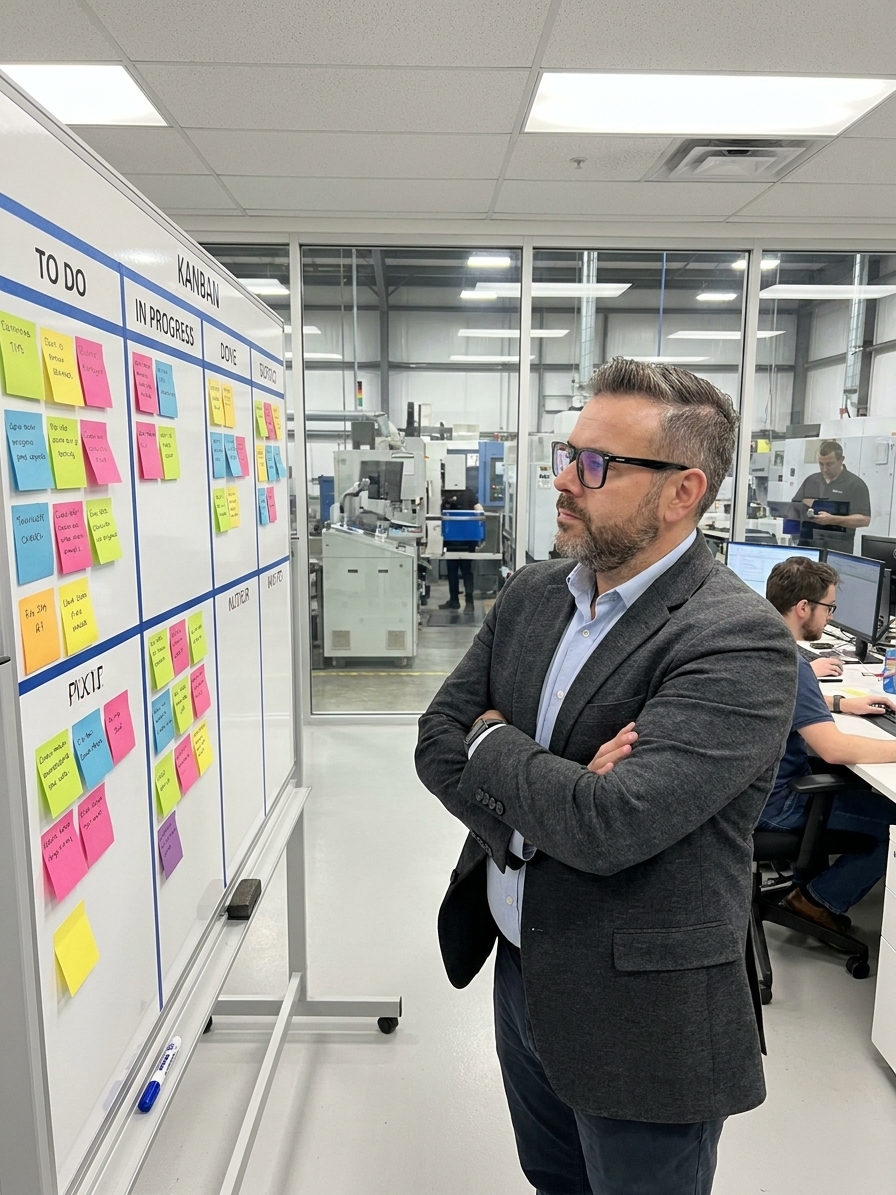
Every quality manager eventually realises they have no idea how many quality problems are actually in progress. Not the figure reported last month, nor the count appearing in the weekly KPI dashboard. I mean the exact volume of open CAPA records, unresolved customer complaints, pending deviations, and stalled improvement projects sitting across various inboxes and shared drives, scattered like unexploded ordnance across the organisation.
The quality system does not lack data. It lacks visibility. When a production line stops, physical parts pile up at a workstation, the conveyor backs up, and the shift supervisor starts pacing. The physical world provides its own signal system, and that signal triggers immediate action. But when quality issues accumulate, nothing visible happens.
Complaints sit silently in an email folder. CAPA investigations stall waiting for root cause data from a lab. Corrective actions get assigned to engineers who already have full-time production responsibilities. This invisible work is the most dangerous kind, because you cannot manage what you cannot see, and you cannot flow what you do not track.
The Illusion of Database Compliance
I have audited plants that had hundreds of open CAPAs spread across different electronic systems. The quality director knew the top-line number because they ran a report every Monday morning. What they did not know was that dozens of those records had been open for over two years, entirely abandoned by their process owners without being formally closed.
The database stated a clean, finite number. The reality was administrative chaos wearing a compliance hat. These organisations were not incompetent. They were simply overwhelmed by work they could not physically see, trying to resolve everything simultaneously and ultimately resolving nothing effectively.
Traditional QMS reporting tracks status, not flow. A report tells you a corrective action is 90% complete. It does not tell you that it has been 90% complete for six months because it is waiting on a single managerial signature. This is where visual management intersects with quality engineering. Kanban is not a software tool; it is a signal system that makes accumulation tangible.
Establishing the Physical Quality Board
Kanban translates to 'signal card'. Its power lies in simplicity. A quality board answers three questions that compliance frameworks like ISO 9001 and IATF 16949 demand but rarely structure effectively: What are we actively working on right now? What is waiting in the backlog? What is verifiably done?

When you force these questions into a physical space, the answers become uncomfortable. If your team of five quality engineers has twenty-three cards in the 'In Progress' column, the arithmetic speaks for itself. Either they are not sleeping, or most of that work is actually stalled. It is waiting, not progressing.
The 'Done' column is a brutal accountability mechanism. An audit finding addressed by a procedure update is not done until that update is audited for effectiveness. A corrective action implemented on the floor is not done until it is verified against the original nonconformity. The physical board demands this honesty, whereas a database permits silent rot.
The Critical Importance of the Blocked Column
Quality work diverges from production work because it is rarely self-contained. Every 8D investigation depends on data from a different department. Every equipment modification requires buy-in from production management. Every effectiveness check needs line time that operations will not readily surrender.
This structural dependency is why the most important column on a quality board is not 'In Progress'. It is 'Blocked'. This column is where a card goes when the assigned engineer has exhausted their immediate options and is waiting on an external input: a pending lab result, a managerial approval, or a scheduled machine downtime for validation.
The Lifecycle of a Visible Quality Issue
- 01Triage & IntakeComplaint or nonconformity is logged, prioritised, and assigned a card.
- 02In Progress (WIP Limited)Engineer actively investigating root cause. Strict limit on active cards.
- 03BlockedWork halted pending external input: lab data, signature, or line time.
- 04Verify EffectivenessCorrective action implemented on the floor; awaiting confirmation it works.
- 05Done / ClosedVerified against the original standard. Formally closed in the QMS.
When you systematically move cards to Blocked, systemic patterns emerge that no QMS report will ever surface. I have seen boards reveal that a staggering percentage of overdue corrective actions were all waiting for a single signature from the plant manager. The quality team had been blaming themselves for months. The board showed them the real bottleneck in minutes.
Applying WIP Limits to Quality Engineering
The most controversial aspect of implementing Kanban in quality is enforcing Work In Progress (WIP) limits. In production, WIP limits are intuitive. You would never load fifty parts onto a machine designed for ten. In quality, suggesting a cap on active investigations feels like heresy.
Engineers argue that you cannot ignore customer complaints or stop logging deviations. They are correct. But WIP limits force a critical distinction between capturing an issue and actually resolving it. The intake process works perfectly. The resolution process fails because teams try to process thirty issues simultaneously, generating administrative overhead without producing investigative depth.
A WIP limit doesn't stop you recording the sixth complaint; it stops you pretending you are investigating it.
Setting a strict limit — say, five active investigations per engineer — transforms the output. Quality professionals stop writing superficial status reports and actually go to the gemba to perform deep root cause analysis. The organisation does not do less quality work; it stops doing quality work badly, and starts driving genuine corrective action.
Compressing the Feedback Cycle
Most quality organisations operate in weekly or monthly cycles. They hold weekly CAPA reviews and monthly management reviews. These governance structures are necessary, but they create an environment where problems hide for days between check-ins. A CAPA that stalls on Wednesday does not surface until the following Tuesday's meeting.
The Impact of Daily Visual Management
The Kanban stand-up compresses this cycle to twenty-four hours. Seven minutes maximum, standing around the board. The protocol is rigid: what did I move yesterday, what am I working on today, and what is blocking me. No defensive explanations, no slide decks.
This daily rhythm exposes dependencies in real time. Blockers are addressed the same day instead of festering into overdue liabilities. The team develops a shared awareness of the system load, which means engineers start coordinating and helping each other instead of working in isolated, parallel silos.
Why the Board Must Be Physical
The moment you propose visual management in quality, someone will lobby to build it electronically inside the QMS. Resist this impulse. The power of a Kanban board is its physicality. It exists in a space people walk past. It creates an ambient signal that forty cards in the backlog column carries actual weight, something a database field labelled '40 open items' completely fails to communicate.
Physical boards generate spontaneous conversation that digital systems destroy. When a quality engineer walks past the board and sees a colleague's card stranded in Blocked, they act. These informal exchanges — offering to chase down a lab result or check a machine parameter — are the invisible connective tissue of effective manufacturing.
Attention is a finite resource. If your team has the capacity to thoroughly investigate ten problems per month, and your manufacturing process generates thirty, twenty problems will receive inadequate analysis. Kanban makes this arithmetic impossible to ignore, forcing leadership to either increase capacity, improve the generating process, or apply risk-based prioritisation.
Kanban does not solve quality problems; it makes them impossible to hide. By exposing the full picture at once, it removes the gap between compliance documentation and shop floor reality. The system was never broken. It just needed a format that permitted no hiding.