Quality Micro-Stops: When Your Machine Pauses for Three Seconds, Five Thousand Times a Shift — and Nobody Notices That Your Factory Lost an Entire Day
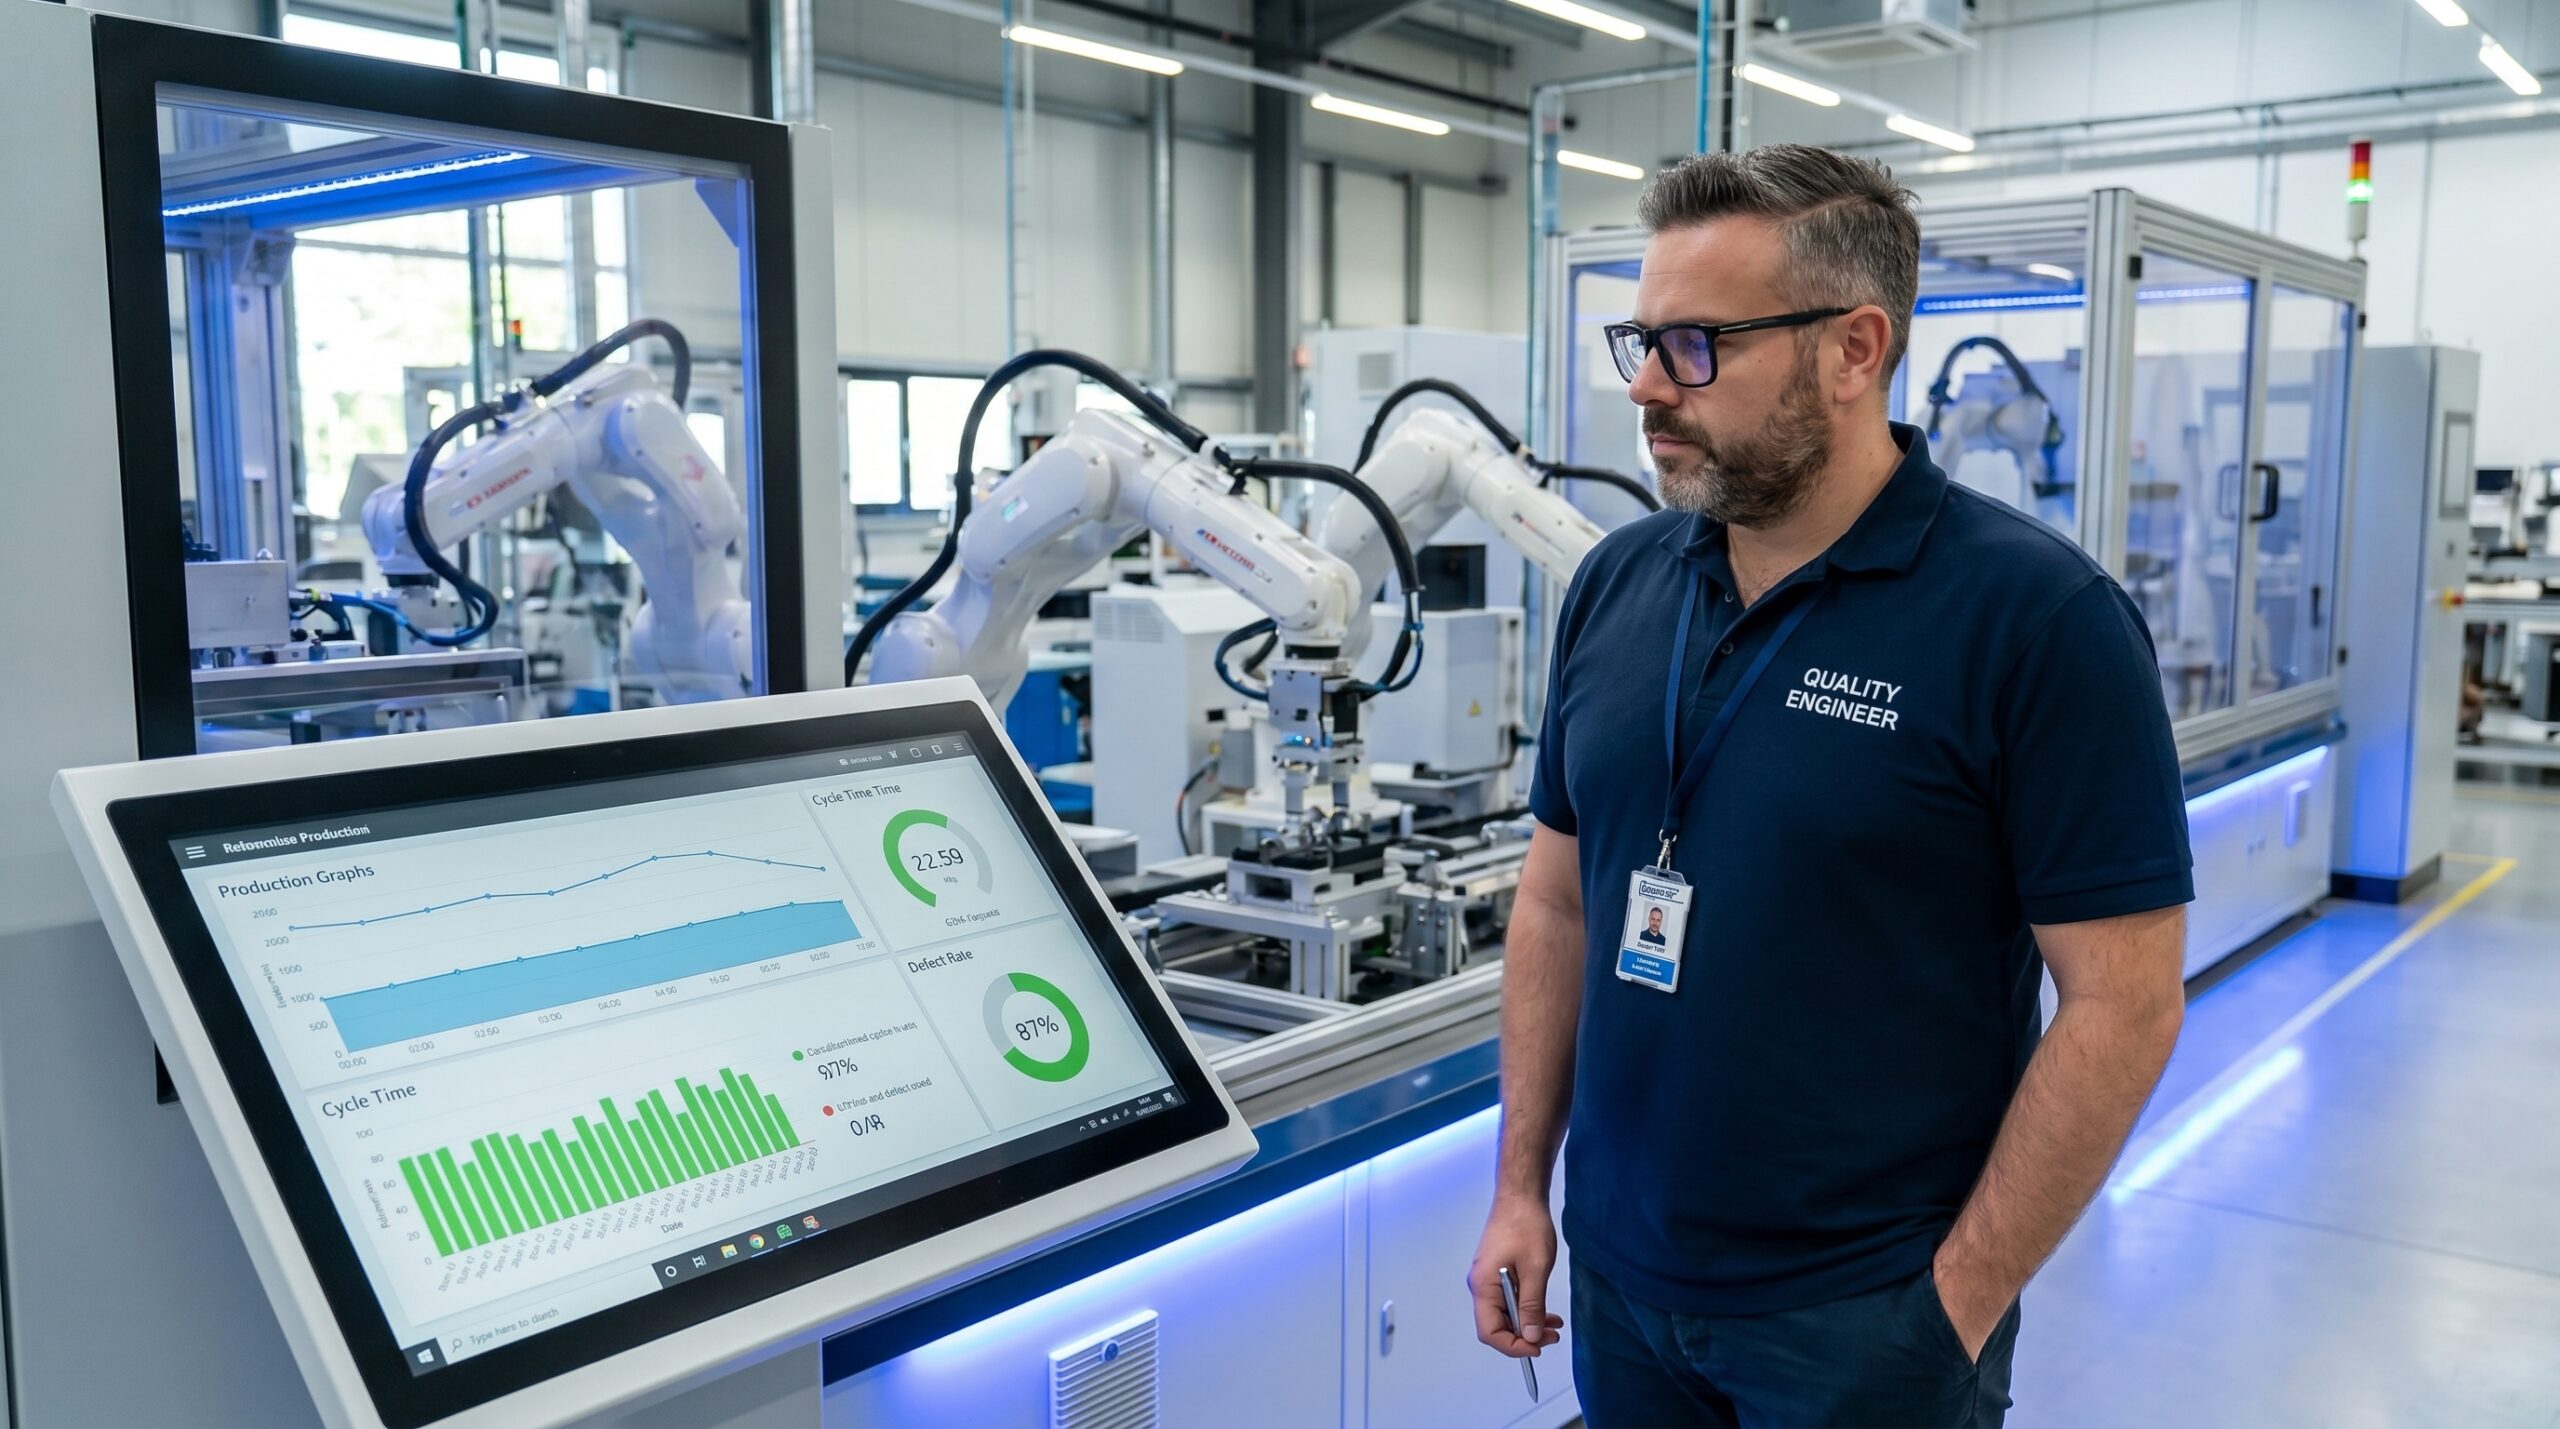
You walk the production floor at 10:14 on a Tuesday morning. Everything looks fine. Machines are running. Operators are working. The Andon board glows a reassuring green. Your OEE dashboard says 82%. You nod, grab a coffee, and head back to your office feeling good about the day.
What you didn’t see is this: between 6:00 AM and 10:14 AM, Press Station 7 stopped four hundred and twelve times. Each stop lasted between two and eight seconds. Most of them were so brief that the operator didn’t even look up. The Andon board never changed color. The OEE system, configured to register only stops longer than sixty seconds, recorded exactly zero of them.
Four hundred and twelve micro-stops. An average of 4.2 seconds each. Twenty-nine minutes of lost production time, invisible to every monitoring system you paid good money to install. And Station 7 is one of twenty identical stations on your line.
Welcome to the hidden epidemic of micro-stops — the quality and productivity killer that lives in the space between your data and your reality.
The Problem You Can’t See
A micro-stop is any brief, often repetitive interruption in your production process that falls below the detection threshold of your standard monitoring systems. It’s not a breakdown — your maintenance team wouldn’t recognize it if you handed them a report. It’s not a quality alert — no defect was produced, at least not immediately. It’s a pause. A hiccup. A moment where the machine hesitated, the fixture jammed for two seconds, the sensor needed a retry, the part didn’t seat properly and the cylinder cycled again.
Individually, each micro-stop is trivial. Two seconds. Three seconds. Maybe five. Who cares about five seconds on a factory that runs twenty-four hours a day?
You should.
Because micro-stops don’t happen once. They happen in patterns. They repeat hundreds or thousands of times per shift. And when you add them up — when you actually measure them, which almost nobody does — they account for some of the largest hidden losses in modern manufacturing.
I’ve worked with plants where micro-stops consumed between 8% and 18% of total available production time. Not the 3% that the OEE dashboard was proudly reporting as “minor stops.” The real number, captured by high-frequency data logging that the plant didn’t even know it could enable, was five to six times higher.
Let me say that differently. These factories were losing nearly a fifth of their capacity to something they weren’t measuring. They were buying new equipment to increase throughput when their existing equipment was already capable — it was just pausing six thousand times a shift.
Where Micro-Stops Hide
Micro-stops are endemic to automated and semi-automated processes, but they manifest differently depending on the type of equipment. Here are the most common hunting grounds:
Assembly stations with pick-and-place systems. The gripper doesn’t achieve a perfect grip on the first try. It retries. The robot hesitates for 1.8 seconds, adjusts, and succeeds. The cycle time on paper is 22 seconds. In reality, it’s 23.8 seconds — but only when the gripper struggles, which happens on roughly 35% of cycles. Your cycle time study, conducted during a clean run with new tooling, never captured this.
Stamping and press operations. The part doesn’t fully eject from the die. The sensor detects a part-in-die condition and delays the next stroke by three seconds. The operator taps the die with a brass rod, the part falls, and the press resumes. This happens forty times an hour. Nobody reports it because the operator has incorporated it into their rhythm — it’s become “just how this machine runs.”
Packaging lines. A carton fails to open properly. The forming station tries again. A label doesn’t apply at the correct position and the reject mechanism pushes it aside. The line doesn’t stop — it just slows for two seconds while the reject flap cycles. Three hundred reject flaps per shift later, you’ve lost significant time and generated a pile of rejected labels nobody is tracking back to a root cause.
CNC machining centers. The tool change takes 6.2 seconds instead of the programmed 4.8 seconds because the tool magazine is sticking slightly on pocket number seven. The machine doesn’t alarm. It just takes longer. Across three hundred tool changes per shift, that 1.4-second discrepancy adds up to seven minutes per shift on a single machine. Multiply by fifteen machines, and you’ve lost over an hour and a half of spindle time.
Welding cells. The wire feed experiences a momentary slip. The weld cycle extends by two seconds while the feeder catches up. The weld is still good — quality isn’t immediately affected — but the cycle time has silently increased. The robot program doesn’t flag it. The operator doesn’t notice it. The only evidence is a slight degradation in parts per hour that everyone attributes to “normal variation.”
The common thread: micro-stops live in the gap between what your process is designed to do and what it actually does, and that gap is too small for standard monitoring to see but too frequent to ignore.
Why Your Quality System Is Blind to Micro-Stops
Most manufacturing plants have invested heavily in monitoring systems — OEE trackers, SCADA platforms, MES solutions, Andon displays. These systems are excellent at capturing what they’re configured to capture. The problem is that almost none of them are configured to capture micro-stops.
Here’s why:
Threshold settings. Most OEE systems have a configurable minimum stop duration. The default is typically 60 seconds, sometimes 30 seconds, occasionally 10 seconds. Anything shorter than the threshold is either ignored entirely or lumped into a generic “minor stops” category that obscures the actual pattern. When your system tells you that minor stops account for 3.2% of your available time, the real number is often dramatically higher.
Cycle time averaging. When you measure cycle times, you typically calculate an average. If the standard cycle is 24 seconds and the actual average is 24.8 seconds, that 0.8-second increase looks like rounding error. But that 0.8 seconds multiplied by 3,600 cycles per shift is 48 minutes — nearly an hour of lost time hiding inside a number that looks trivial.
Operator normalization. Human beings are extraordinary adaptation machines. When a machine micro-stops several times per hour, operators unconsciously adjust their rhythm to account for it. They don’t report it because it doesn’t feel like a problem — it feels like normal. I’ve interviewed operators who had developed elaborate workarounds for micro-stops that had been occurring for years. When I asked when the problem started, they said, “It’s always been like that.”
Alarm fatigue in reverse. We talk about alarm fatigue — too many alarms causing people to ignore them. Micro-stops suffer from the opposite problem: no alarms at all. Because each individual event is too small to trigger a notification, no one is ever alerted. The problem exists below the organization’s sensory threshold.
The Quality Connection
Micro-stops are often framed as a productivity issue — lost time, reduced throughput, lower OEE. But they are equally a quality issue, and this is where most organizations miss the real risk.
Process instability. Every micro-stop is a disruption to process rhythm. And process rhythm is one of the most underappreciated factors in consistent quality output. When a machine pauses and restarts, the thermal equilibrium shifts. The lubrication film breaks. The positional repeatability degrades by microns that compound across thousands of cycles. The process is no longer in steady state — it’s in a perpetual cycle of starting and stopping.
Hidden defects. Some micro-stops are the process protecting itself — a sensor detecting a misaligned part and retrying. But what happens when the retry succeeds but the part was slightly damaged during the initial misalignment? The process continued, no defect was flagged, but a latent quality issue has been introduced. I’ve seen cases where a persistent micro-stop at a welding cell was actually an early warning sign of a fixture alignment problem that eventually produced a batch of out-of-spec welds three weeks later.
Inconsistent process parameters. Micro-stops often cause parameter variations that don’t trigger alarms but affect product characteristics. A plastic injection molding machine that micro-stops may produce parts with subtly different crystalline structures due to altered residence time in the barrel. The parts pass dimensional inspection but fail in the field six months later due to reduced impact strength.
Operator workaround defects. When operators adapt to chronic micro-stops, they develop informal fixes — tapping, nudging, adjusting timing, skipping steps. Each workaround is a deviation from standard work, and each deviation is a potential quality risk. The workaround becomes the new standard, and the original process design is lost.
How to Hunt Micro-Stops
Detecting micro-stops requires deliberately lowering your detection threshold. Here’s a systematic approach:
Step 1: Enable High-Frequency Data Capture
Most modern PLCs and CNC controllers record cycle-level data that never makes it to the OEE dashboard. Enable high-frequency logging — ideally at the individual cycle level — for your critical stations. You want timestamp, cycle time, and any error codes for every single cycle, not aggregated averages.
If your equipment doesn’t support this natively, external sensors can fill the gap. A simple current sensor on a machine can detect the current signature of each cycle and identify anomalies down to the sub-second level.
Step 2: Build a Cycle Time Distribution
Don’t look at averages. Look at distributions. Plot a histogram of individual cycle times for each station over a representative period — at least one full shift, preferably a full week. The shape of this distribution is far more revealing than any average.
A healthy process produces a tight, roughly normal distribution centered on the designed cycle time. A process suffering from micro-stops shows a bimodal distribution — a main peak at the normal cycle time and a secondary peak or long tail at the extended cycle time. That secondary peak is your micro-stop signature.
Step 3: Pattern Analysis
Once you’ve identified which stations are experiencing micro-stops, analyze the patterns. Are they random or cyclical? Do they correlate with specific products, tools, operators, or environmental conditions? Do they increase over the course of a shift, suggesting thermal or wear-related causes?
A Pareto analysis of micro-stop frequency by station, by cause code, and by time period will typically reveal that a small number of root causes drive the majority of micro-stops — the same 80/20 principle that governs most quality phenomena.
Step 4: Go to the Gemba
Data tells you where to look. Observation tells you what’s happening. Stand at the identified station for thirty minutes with a stopwatch and a notepad. Count every hesitation, every retry, every moment where the machine doesn’t move as expected. Compare your count to the data. In my experience, the data always undercounts reality — there are micro-stops too subtle even for the sensors.
Talk to the operator. Ask them: “Does this machine ever hesitate? Does it ever retry an action? Are there moments where it seems to take a breath?” You’ll be amazed at what people will tell you once they realize you’re genuinely interested in understanding their work.
The Fix: From Detection to Elimination
Once you’ve identified and quantified your micro-stops, the resolution follows standard problem-solving methodology — but with a few nuances specific to this type of loss:
Mechanical causes. Sticking slides, worn bushings, contaminated pneumatic valves, misadjusted sensors. These are the most common root causes and the most straightforward to fix. The challenge is that they’re typically too minor to trigger a maintenance work order in a reactive maintenance environment. The solution: treat chronic micro-stops as a maintenance priority equal to any breakdown. Add micro-stop rate to your preventive maintenance triggers.
Programming causes. Overly conservative retry timers, unnecessary confirmation waits, sensor debounce delays. Many micro-stops are literally programmed into the machine — the PLC logic includes extra wait states that were added during commissioning to solve a problem that no longer exists. A systematic review of PLC timers and interlocks for a chronic micro-stop station often yields 15-30% cycle time improvement with zero hardware changes.
Material causes. Parts that don’t consistently meet dimensional specifications within tolerance but at the extremes of the tolerance range can cause feeding, locating, and seating issues that manifest as micro-stops. This is where micro-stop analysis intersects with incoming quality and tolerance management. Tightening component tolerances at the source — or widening fixture acceptance at the station — can eliminate thousands of micro-stops per shift.
Environmental causes. Temperature swings affecting machine alignment, humidity affecting material behavior, vibration from adjacent equipment affecting sensor readings. These are the hardest to diagnose and the most likely to be dismissed as unprovable. But if your micro-stop rate shows a correlation with time of day, season, or production mix, environmental factors are worth investigating.
The Business Case
Let me make this concrete with a real example from a plant I worked with — an automotive components manufacturer running a 40-station automated assembly line.
The plant’s OEE system reported availability of 91%, with minor stops contributing 2.3%. After implementing cycle-level data capture, the reality emerged: micro-stops were consuming an additional 11.7% of available time. The line was effectively running at 79.3% availability, not the reported 91%.
The resolution required no capital investment. It took six weeks of systematic micro-stop hunting — adjusting sensor positions, cleaning pneumatic valves, optimizing PLC timers, and tightening two incoming material specifications. The result: micro-stop rate dropped from 11.7% to 2.1%. Effective availability increased from 79.3% to 89.2%.
That’s an additional 48 minutes of production per shift. Two shifts per day. Three hundred operating days per year. Four hundred and eighty hours of additional annual capacity from existing equipment, existing staff, and existing infrastructure.
At their throughput rate, that was worth approximately 2.3 million dollars per year in additional revenue — unlocked by fixing pauses that nobody could see.
Building a Micro-Stop Discipline
Micro-stops are not a one-time problem. They’re a chronic condition that requires ongoing management. Here’s how to build a sustainable discipline:
Include micro-stop rate in your daily management system. Add it to the production board. Track it alongside first-pass yield, scrap rate, and OEE. Make it visible. What gets measured gets managed, but only if people can see the measurement.
Set cycle-level thresholds. Define what constitutes a micro-stop for each critical station and set automated alerts when the rate exceeds the threshold. This turns an invisible problem into a visible signal.
Train operators to report rhythm changes. Operators are your front-line micro-stop detectors. Teach them to recognize when a machine’s rhythm changes — even if it doesn’t stop completely. “The machine feels different today” is data, not superstition.
Include micro-stop analysis in your Layered Process Audits. When auditors observe a station, they should spend part of their observation watching for hesitations, retries, and cycle time variations that the dashboard doesn’t capture.
Review micro-stop trends in your monthly quality reviews. Not as a footnote under OEE, but as a standalone metric with its own trend chart, its own targets, and its own corrective action log.
The Deeper Lesson
Micro-stops are a metaphor for a broader truth in quality management: the things that hurt you most are often the things you’re not measuring. We build elaborate systems to detect what we already know to look for, and then we trust those systems to tell us everything. But the most dangerous problems are the ones that exist below the threshold of our awareness — not because they’re inherently invisible, but because we never thought to lower the threshold.
Every factory has micro-stops. Every line has hesitations that nobody counts. Every process has a gap between its designed performance and its actual performance that hides in the noise of daily operations. The question isn’t whether these gaps exist. The question is whether you have the discipline to look for them — and the courage to believe what you find.
Your machine paused for three seconds. Then it paused again. And again. Five thousand times this shift. The data didn’t record it. The operator didn’t report it. The dashboard didn’t flag it.
But now you know it’s happening. And knowing is where improvement begins.
Peter Stasko is a Quality Architect with over 25 years of experience transforming manufacturing operations across automotive, electronics, and industrial sectors. He specializes in bridging the gap between theoretical quality frameworks and practical shop-floor implementation — helping organizations see what their dashboards can’t.