Most manufacturing plants manage quality exceptions through an exhausting iteration tax. A customer complaint triggers an email chain, followed by a scheduling conflict, and eventually a meeting where half the attendees lack the necessary process data. By the time a preliminary root cause analysis circulates, it contradicts another team's findings. Three weeks pass before anyone verifies a corrective action. This functional lag destroys customer trust and allows underlying process drift to continue generating scrap.
I have seen this cycle across automotive and aerospace plants. During my work implementing ISO 9001 and AS9100 systems, the primary bottleneck was rarely a lack of technical competence or measurement capability. The failure was almost always organizational latency. The data existed, the expertise was present, but the environment did not allow them to converge at the point of decision.
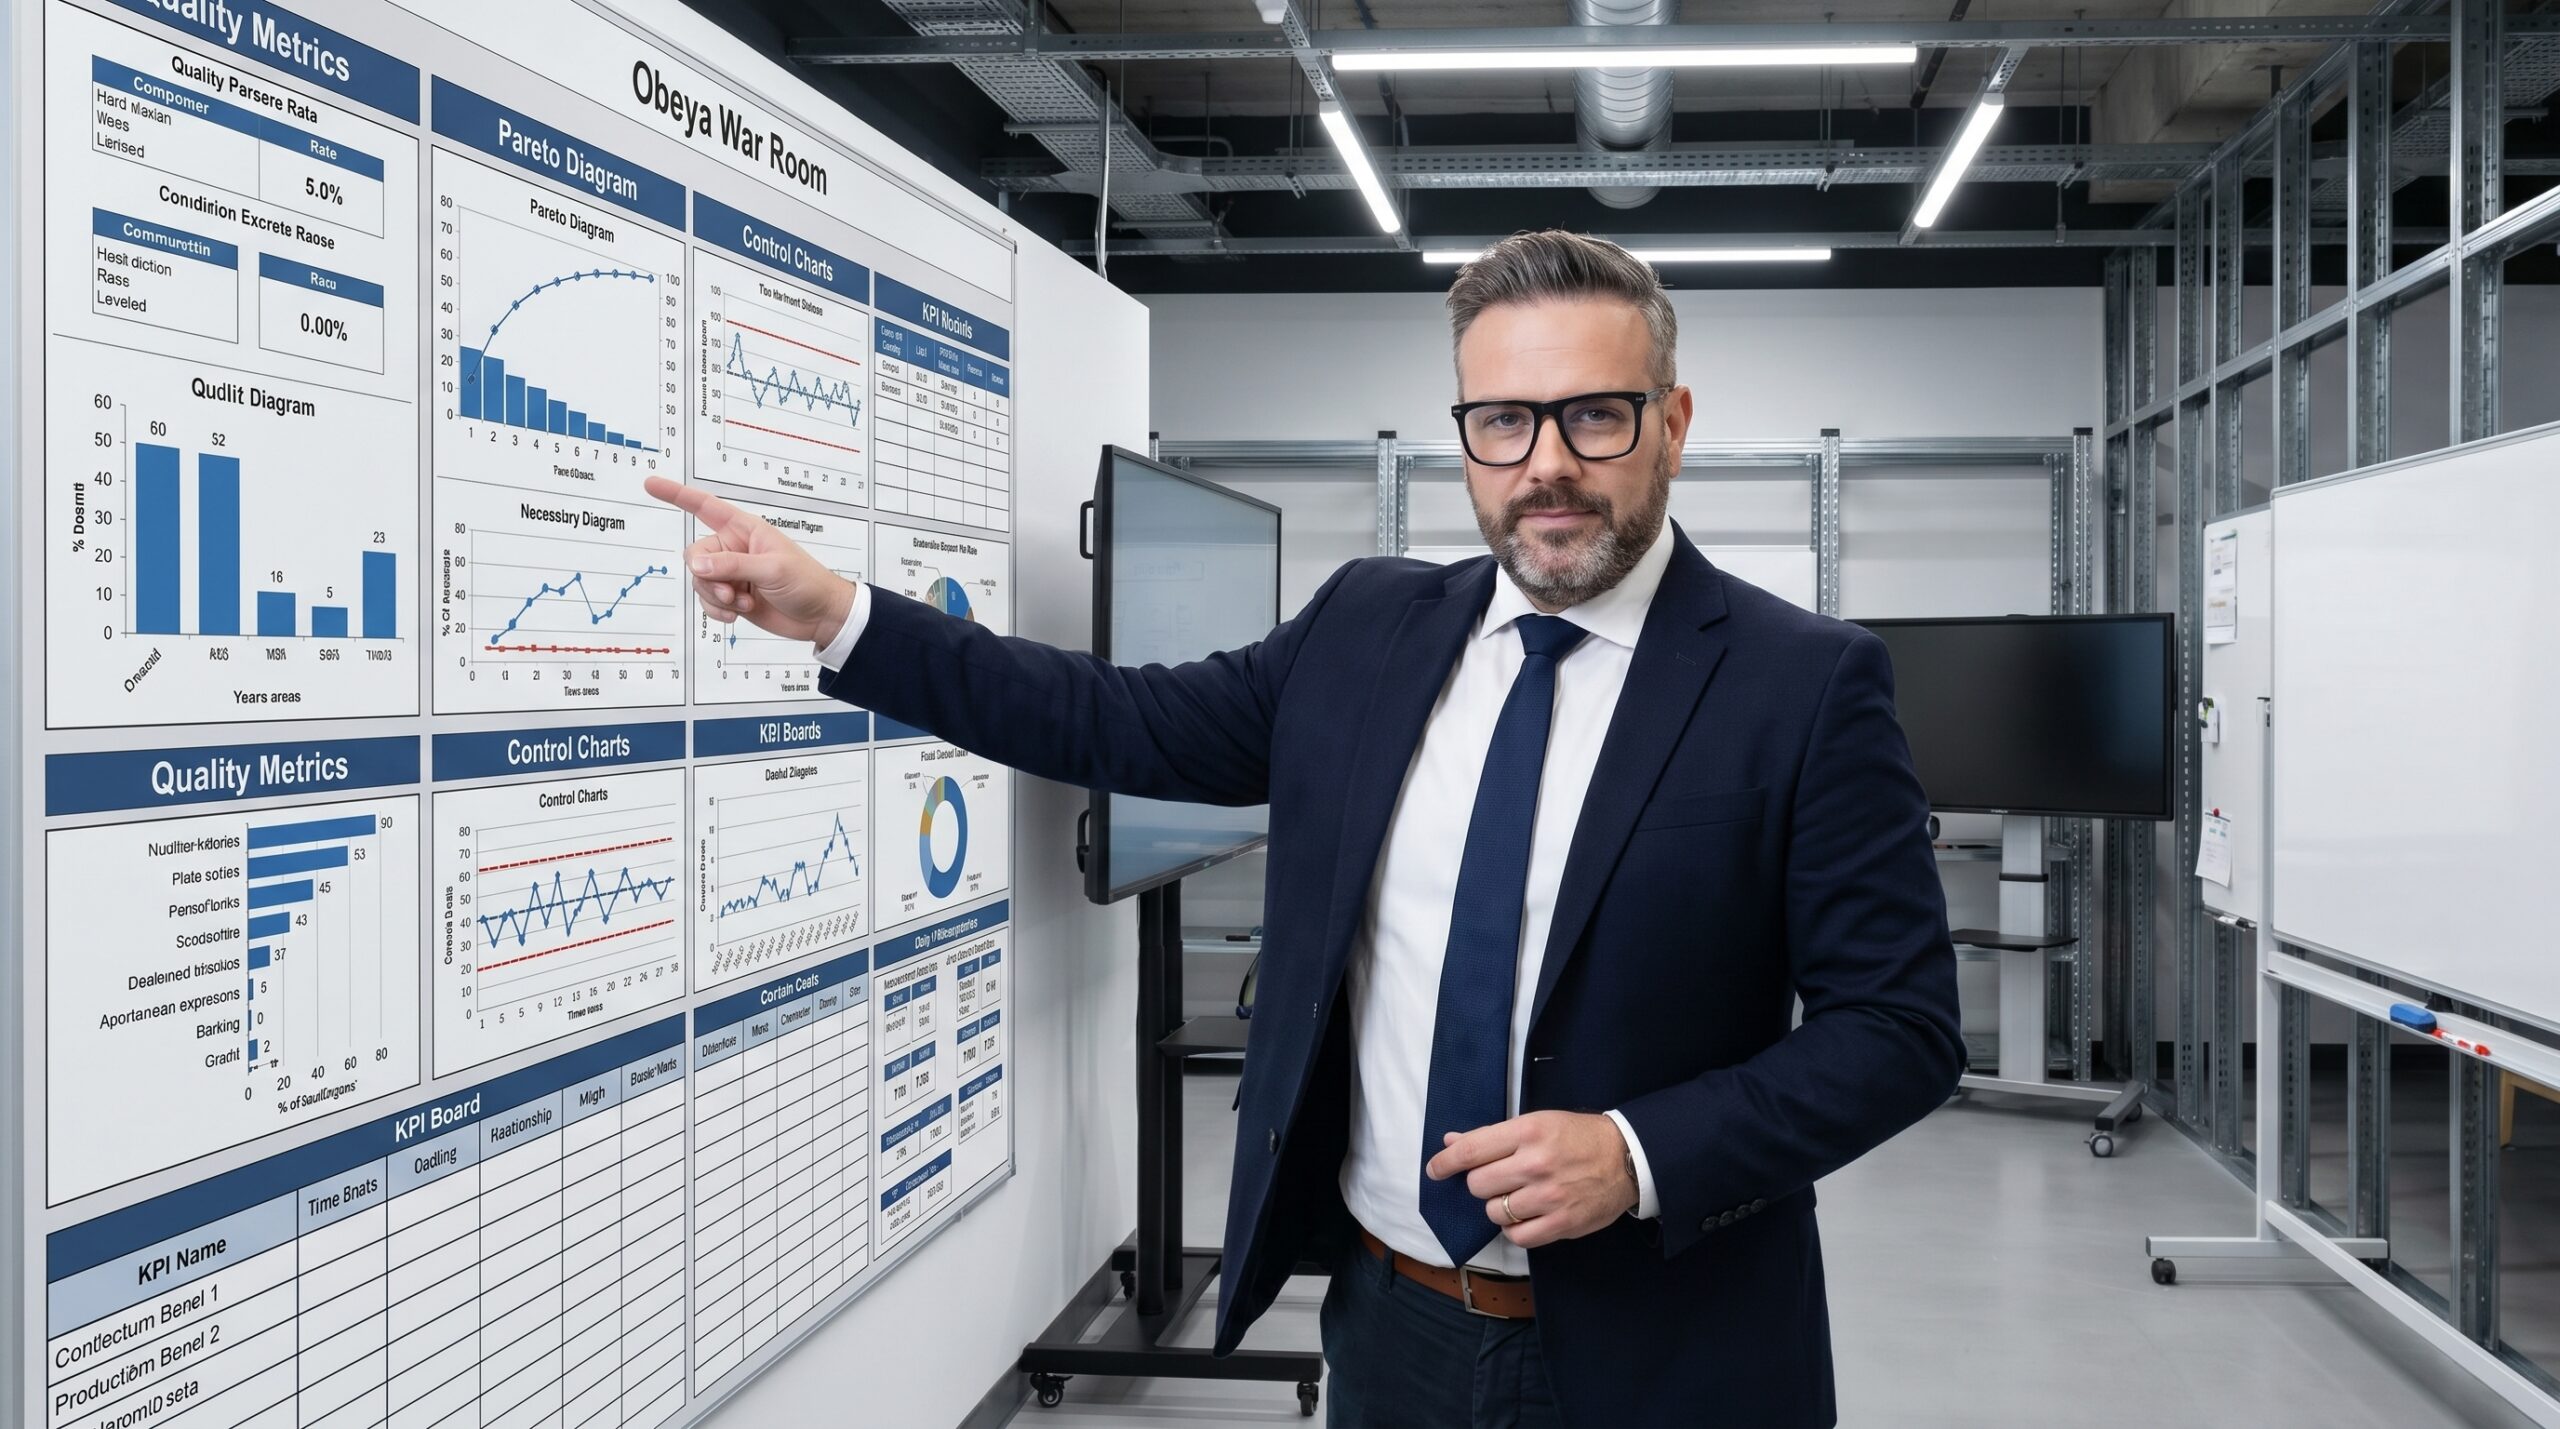
A Quality Obeya directly attacks this latency. Adapted from Toyota's project management rooms used during the Prius development, it is a dedicated physical space where a cross-functional team visualizes quality performance, conducts rapid problem-solving, and makes commitments in real time. It transforms quality from a reporting function into a daily operational discipline.
Why Physical Space Outperforms Digital Dashboards
Organizations routinely attempt to replicate the Obeya concept using digital dashboards, intranet sites, or shared slide decks. These tools are excellent for distributing standardized reports across multi-site networks, but they fundamentally fail at rapid problem-solving. A screen isolates the user, contextualizes data into a rigid format, and eliminates the peripheral awareness necessary for cross-functional discovery.
Physical walls provide ambient intelligence. When an engineer walks past a Pareto chart of top scrap reasons on the way to the coffee machine, they absorb the trend. When a production supervisor sees an active 8D report pinned next to a control plan, the connection between a process change and a customer defect becomes immediately apparent. Digital tools require you to look for information; a physical Obeya forces you to see it.
The medium also dictates the pace of interaction. Digital communication encourages asynchronous, carefully worded responses that slow down the problem-solving cycle. A physical room demands synchronous, unfiltered conversation. When two engineers stand in front of an Ishikawa diagram and debate the validity of a branch from different perspectives, they resolve discrepancies in minutes. That same debate via email takes days.

The Five Zones of an Effective Obeya
A functional Obeya is not a random collection of charts. The room must be structured into specific zones that mirror the PDCA cycle. The layout should guide the team from high-level performance monitoring down to granular root cause analysis, ending with concrete action assignment. If a zone does not actively drive a decision, it is visual clutter and should be removed.
The Performance Wall displays your critical metrics: top scrap Pareto, customer complaint trackers, and SPC overviews from the control plan. The Problem-Solving Wall hosts active 8D and A3 reports, evolving Ishikawa diagrams, and 5 Why analyses. The Customer Voice Wall prints complaints verbatim, forcing the organization to confront the actual language used by the customer rather than a sanitized internal summary.
The Process Wall links these outcomes to operational reality using PFMEA summaries, flow diagrams, and recent change logs. Finally, the Action and Accountability Wall captures commitments. This is where the room imposes discipline. Every action item must have a single owner, a specific deadline, and a clear measurable output. 'The team will investigate' is not an action. 'Maria will collect fifty consecutive pieces from Station 3 and measure diameter by Thursday at 14:00' is an action.
Daily Obeya Problem-Solving Flow
- 01Issue DetectionProblem is identified from SPC triggers, scrap Pareto, or customer feedback.
- 02Wall AssignmentIssue gets a dedicated physical space on the Problem-Solving Wall immediately.
- 03Rapid AnalysisCross-functional team conducts 5 Why and Ishikawa analysis standing at the wall.
- 04Action DefinitionCountermeasures are written on the Action Wall with specific owners and deadlines.
- 05VerificationEffectiveness of the action is checked against SPC and Pareto data the next day.
Establishing the Operating Rhythm
A room with excellent visual management is useless without a rigid cadence. The Obeya operates on a strict hierarchy of meetings, each with a specific purpose, duration, and participant list. This rhythm ensures the data on the walls remains current and the team remains synchronized. If the data is stale, the room is dead.
The core interaction is the daily stand-up, lasting no more than fifteen minutes. Held at the same time every morning, this is a synchronization event, not a status update. The quality team reviews what happened in the last twenty-four hours, checks the status of open actions, and flags any new issues. The goal is to identify barriers and assign immediate tasks, not to listen to managers report upward.
Once a week, the team conducts a sixty-minute deep dive. This session reviews trend analysis to determine if the plant is improving or deteriorating, assesses the effectiveness of recently implemented corrective actions, and allocates resources for complex problems. The daily stand-up drives urgency; the weekly deep dive drives strategic adjustment.
Enforcing Non-Negotiable Rules
Sustaining an Obeya requires strict adherence to operational rules. The most critical rule is that the room is alive. If the data on the walls is more than twenty-four hours old, the visual management becomes decoration, and shop floor trust evaporates. The second rule eliminates chairs. Stand-up meetings are shorter, more focused, and maintain a level of physical urgency that translates into faster decision-making.
The room must enforce a single source of truth. The walls are the official record of the quality system. If an action, a root cause, or a metric is not on the wall, it does not exist. This eliminates the scenario where three different departments maintain conflicting versions of a spreadsheet. The Obeya forces reconciliation.
If a metric or an action is not on the wall, it does not exist in the operational reality of the plant.
Cross-functional presence is mandatory. The Obeya belongs to the entire value stream, not just the quality department. Production, engineering, logistics, and maintenance must actively participate. If the quality team is the only group standing in the room, the system has failed. Quality outcomes are generated by the process, and the process is controlled by production and engineering.
Avoiding the Museum and Complexity Traps
I have audited plants where the Obeya has degraded into a showroom. The walls feature beautifully designed, laminated charts that have not been updated in a month. Visitors are brought in to admire the visual management, but the daily stand-up was cancelled weeks ago. This museum effect occurs when leadership treats the room as a project rather than an operating system.
The opposite failure is the complexity trap. Driven by enthusiasm, teams pin every available metric, process map, and audit finding to the walls. The room becomes visually overwhelming. When people are forced to look at everything, they process nothing. An effective Obeya applies strict Pareto discipline to its own walls, displaying only the critical few metrics that drive current operational decisions.
Hierarchy also destroys Obeya effectiveness. If plant managers stand at the front of the room demanding answers from subordinates, the dynamic shifts from collaborative problem-solving to defensive reporting. The room must feel like a command centre where titles are temporarily suspended in favour of process knowledge.
Obeya Implementation: Common Failure vs Functional Reality
What fails
- Data older than 24 hours breeds distrust
- Quality department acts alone in isolation
- Every available chart posted, overwhelming users
- Seated status reporting to management
What works
- Strict 24-hour maximum update rule for all metrics
- Production and engineering hold equal ownership
- Pareto discipline limits display to critical few
- Standing problem-solving with assigned actions
Measuring the Impact on Lead Time
The success of a Quality Obeya is measured by its impact on problem-solving velocity and defect prevention. The primary indicators are the time from problem detection to verified root cause, and the subsequent time to implemented corrective action. A functional Obeya compresses both of these timelines significantly by eliminating communication latency.
When I introduced Routing Verification KPIs at a major aerospace manufacturer, the core principle was identical: reduce the gap between detection and action. A well-run Obeya typically cuts time-to-root-cause drastically by placing the necessary data and experts in the same physical space. Secondary metrics include the repeat problem rate, which indicates whether the team is permanently fixing root causes or merely treating symptoms.
To begin implementation, find a room near the production floor, clear the walls, and print your top five current quality issues and latest scrap Pareto. Gather the cross-functional team for a daily fifteen-minute stand-up. Within a week, the reduction in organizational friction will be apparent. The Obeya proves that most quality failures are not a lack of knowledge, but a failure of convergence.
Core Metrics for Obeya Effectiveness