In 1975, economist Sam Peltzman published a study on mandatory seatbelt legislation. He found that while fatalities per accident decreased, the overall accident rate rose. Drivers, feeling protected by the belts, drove more aggressively. The safety equipment altered their behaviour. The total societal harm barely shifted.
This is not a treatise on traffic safety. It is a diagnostic reality check for your shop floor. Risk compensation is active in your quality management system right now. Every automated vision system, final inspection gate, and rework station you install acts as a safety net that subtly recalculates the risk tolerance of your operators.
When you add a layer of protection, human beings adapt their effort to match the perceived new level of danger. I have audited plants where heavy investments in automated inspection actually degraded overall process capability. The safety net did not eliminate failure. It incentivised the behaviours that caused it.
The Mechanics of Behavioural Erosion
Installing a sophisticated automated inspection system at the end of the line produces immediate metrics. The scanner catches defects that humans missed. Defect rates plummet. Management approves the capital expenditure.
Simultaneously, a parallel process begins. The psychological safety net shifts the operators' internal risk calculus. In-process checks become perfunctory. Setup procedures lose their precision. The mental edge required to manufacture quality parts at the source dulls. Operators are not acting maliciously. They are optimizing effort.
You have not eliminated defects. You have transferred the quality burden from a distributed, human-aware system to a single technological checkpoint. When that checkpoint experiences a calibration drift, a software misclassification, or an edge-case failure mode, the floodgates open. The human vigilance that once acted as the primary defence has atrophied entirely.

Where Safety Nets Become Systemic Threats
Risk compensation thrives across multiple manufacturing layers. Excessive rework capacity is a primary carrier. When you build an efficient rework cell with skilled technicians, you drastically lower the economic cost of producing a defect. The urgency to prevent failure at the source drops proportionally.
Generous safety stock operates identically. When warehouse buffer inventory covers weeks of potential defects, root cause analysis becomes a logistical scheduling problem rather than an engineering priority. The organization learns to absorb failure instead of eliminating it, which nullifies the core intent of IATF 16949 preventive action.
Forgiving specification limits accelerate the decay. Wide tolerances invite operators to target the centre with less precision. Process spread increases. When you eventually win a contract requiring Cpk 1.67, you discover your actual process capability has been quietly degrading for years. You lack the statistical foundation to meet the new requirement.
Inspection vs. Process Discipline
What teams do
- Rely on automated vision to catch edge defects
- Target the centre of wide, forgiving tolerances
- Treat rework as a standard production routing
- Defer root cause analysis due to buffer stock
What works
- Maintain independent human verification routines
- Use control charts to drive continuous targeting
- Budget rework as an exceptional 8D action
- Trigger immediate 5-Why analysis on safety stock drops
Symptoms of the Peltzman Effect in Your Plant
Diagnosing risk compensation requires looking past the final delivery metrics. The most obvious symptom is declining first-pass yield paired with stable final quality. If your outgoing PPM rate looks excellent but your in-process scrap rate is climbing, you are not improving. You are simply filtering harder.
Another indicator is the normalization of rework. If your annual budget includes a permanent line item for sorting and rework, and nobody questions its existence during MRM reviews, risk compensation has taken root. Rework should be a temporary 8D exception, not a standard feature of your production landscape.
Watch for inspection proliferation. If the default response to a customer complaint is adding another inspection checkpoint, you are building a thicker safety net without addressing the behavioural erosion underneath it. More inspections accelerate the decline because each checkpoint reinforces that someone else is responsible for catching defects.
You haven't eliminated defects. You've moved them downstream and called it quality control.
Designing Defences That Do Not Invite Risk
The solution is not to remove safety nets. That violates AS9100 and IATF 16949 requirements, and it is operationally reckless. The solution is engineering quality systems that account for behavioural response. You must provide protection without providing permission to degrade the process.
Design for inherent quality. Implement poka-yoke devices that physically prevent errors at the source. These error-proofing mechanisms do not trigger risk compensation because they remove the operator's choice to make a mistake. There is no safety net to rely on because there is no fall to take.
Maintain human engagement through dual verification. Automated systems perform their checks, and operators perform independent visual or dimensional checks without first seeing the automated results. This preserves vigilance while utilizing technology. Yes, it costs labour minutes, but it prevents the skills atrophy that leads to catastrophic single points of failure.
Tie your primary metrics to the source. Measure and reward first-pass yield, not final defect rates. When management dashboards emphasize the health of the process rather than the effectiveness of the inspection filter, accountability shifts back to the point of origin.
Key Metrics for Risk Compensation Monitoring
Diagnosing Process Drift and Skill Atrophy
Walk the floor and talk to your veteran operators. Ask them how their daily routine has changed since the new automated vision system or CMM was installed. If they casually mention they do not need to watch as carefully, the Peltzman Effect is already reshaping your workforce capabilities.
Statistical process control often masks this drift. When control charts automatically generate alerts, operators stop developing their intuitive feel for the machinery. They wait for an alarm instead of sensing the gradual drift in vibration, temperature, or surface finish. This intuitive human pattern recognition remains critical for identifying novel, multi-variable failure modes.
Audit the safety net itself. Most organizations audit their manufacturing processes against ISO 9001 requirements. Few audit their quality controls for behavioural side effects. Add a periodic layer to your internal audit schedule that asks whether the introduction of a specific control has changed upstream behaviour. Check if PFMEA documentation accurately reflects current human engagement at each station.
Restoring Process Discipline on the Floor
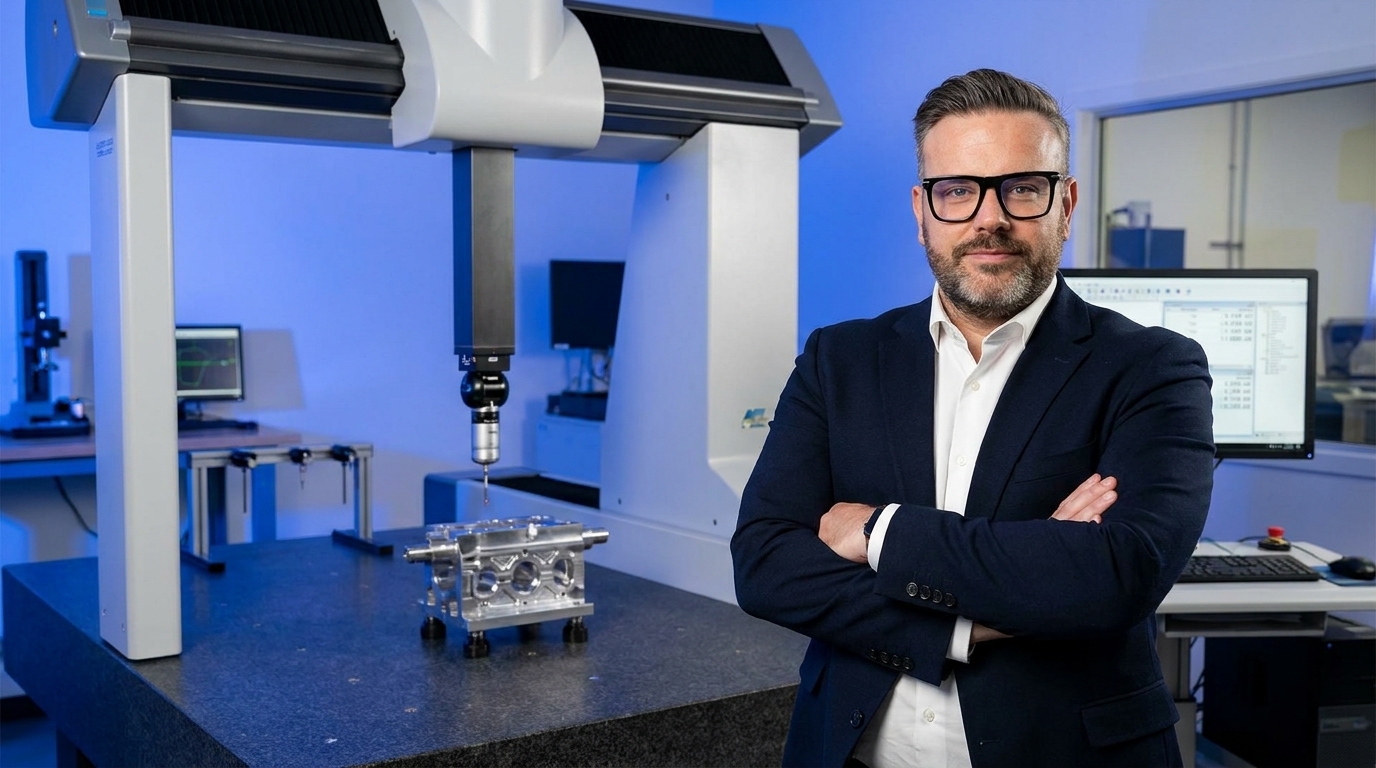
Consider what happens when coordinate measuring machines replace standard workholding fixtures. I worked with a precision machining supplier that placed portable CMMs directly on the shop floor. Their measurement capability was exceptional, and customers rated them a preferred supplier.
When I walked the floor, I noticed operators setting up jobs without using the engineered setup fixtures. They relied on trial-and-error machining followed by CMM verification. The CMM told them exactly how far off they were, so they machined, measured, and corrected iteratively. The setup that took ten minutes with a fixture now took forty-five minutes of machine time.
The material waste from trial cuts and the consumed machine time were invisible on executive dashboards. The operator had outsourced his craftsmanship to a measuring machine. The Peltzman Effect had turned a significant measurement investment into a subsidy for poor setup technique.
We reinstated mandatory fixture use for all job setups. The CMMs reverted to verification tools rather than correction tools. Within six weeks, first-pass yield climbed and setup time dropped dramatically. The operators rediscovered the process discipline that the safety net had quietly stolen.