
Walk into any automotive plant and you will find a dashboard displaying yield. Usually green, often between 90% and 98%. It is the number operations managers use to prove the line is running well. But it is almost always a lie.
That number is Traditional Yield. It counts any unit that eventually leaves the end of the line as good. It does not care if that unit was reworked three times, re-machined, or passed through inspection twice before shipping. By ignoring the hidden factory of rework, management systematically overestimates process capability and underestimates manufacturing costs.
The metric that dismantles this illusion is Rolled Throughput Yield (RTY). Having implemented quality management systems at plants across Europe, I have yet to find a facility that relies solely on Traditional Yield and does not have a severe, unrecognised waste problem. RTY calculates the true probability of a product passing through every operation completely defect-free. When you measure it for the first time, the gap between perception and reality is staggering.
The Mathematics of Cumulative Failure
First Time Yield (FTY) is the foundational element of RTY. FTY measures the percentage of units that pass a single operation without any rework, repair, or deviation on the first attempt. It is pure, unadulterated first-pass success. Traditional Yield, conversely, counts units that eventually pass, burying the evidence of any in-process fixes.
Rolled Throughput Yield multiplies the FTY of every sequential operation in a process. The formula is straightforward: RTY equals FTY of Step 1 multiplied by FTY of Step 2, continuing through to the final step. Because probabilities compound, even minor imperfections at individual stations drag the overall process success rate down rapidly.
Consider a manufacturing line with ten sequential operations. If each step achieves a strong 98% FTY, management will likely report a world-class process. But when you run the RTY calculation—0.98 to the power of 10—the result is 0.817. Nearly 18% of products experienced at least one defect during manufacturing. In a high-volume automotive environment, that hidden 18% represents massive wasted labour, machine time, and material.
The RTY Compounding Effect
This is why Traditional Yield is dangerous. It acts as a painkiller that masks the symptoms of a disease while the underlying infection spreads. Management feels confident because the dashboard says 96%, but the cost of poor quality is quietly consuming the plant's profit margin on the shop floor every single shift.
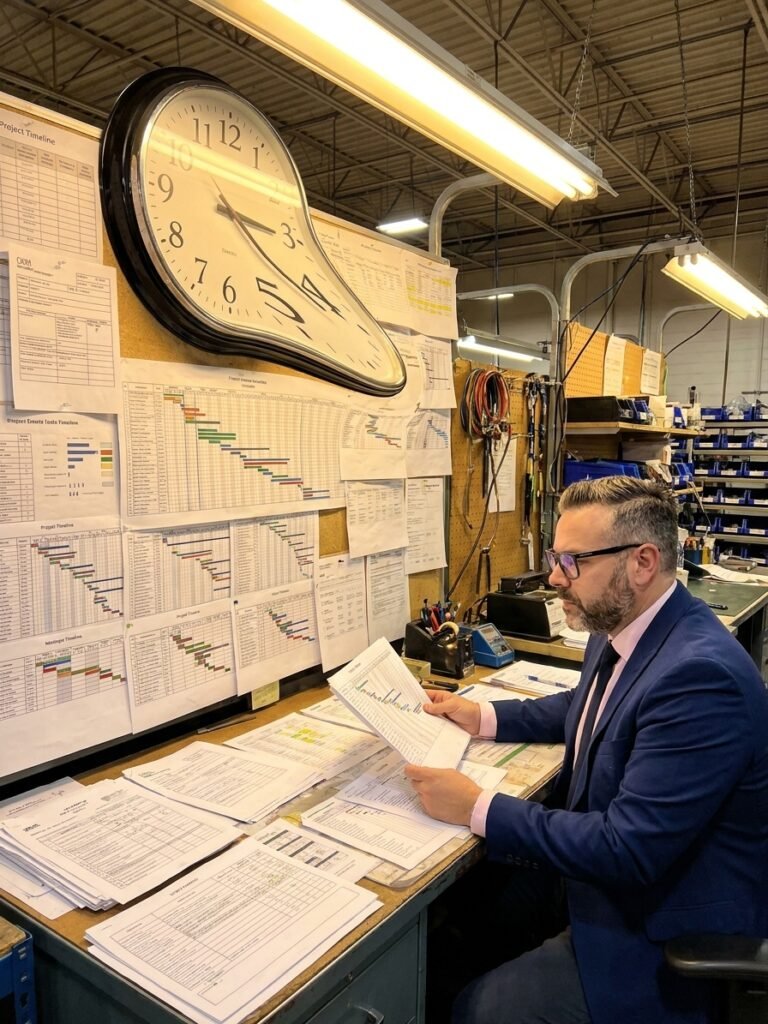
Unmasking the Hidden Factory
I audited a Slovakian automotive supplier where the central LED dashboard proudly displayed a continuous 96.2% Traditional Yield. The management team was satisfied, having spent four years pushing that number up from 88%. They believed their IATF 16949 system was delivering world-class quality.
I requested the raw shift data for all seven main operations: blanking, bending, welding, machining, surface treatment, assembly, and final inspection. The discrepancy between Traditional Yield and First Time Yield was immediate. Welding showed a Traditional Yield of 97.5%, but an FTY of only 94.8%. Assembly was hiding similar damage: 97.8% Traditional Yield against a 95.9% FTY.
When we multiplied the actual FTY figures across the seven stations, the true picture emerged. The RTY was 81.3%. Nearly one in five products required some form of intervention before leaving the plant. The 15-percentage-point gap between the reported 96.2% and the actual 81.3% was entirely hidden rework. This invisible factory of repairs was operating at full capacity, consuming labour and material that had never been budgeted for.
| Operation | Traditional Yield | First Time Yield (FTY) |
|---|---|---|
| 1. Blanking | 99.1% | 98.7% |
| 2. Bending | 98.8% | 97.2% |
| 3. Welding | 97.5% | 94.8% |
| 4. Machining | 99.0% | 98.1% |
| 5. Surface Treatment | 98.2% | 96.5% |
| 6. Assembly | 97.8% | 95.9% |
| 7. Final Inspection | 99.5% | 99.1% |
The Economics of Rework
To understand the business impact, map the RTY directly to financial data. In the same Slovakian plant, each unit cost roughly 45 euros in raw material and direct labour to produce. With a daily volume of 2,000 units and an RTY of 81.3%, only 1,626 units passed defect-free. The remaining 374 units required manual intervention.
Assuming a conservative average rework cost of 12 euros per unit—covering labour, machine time, and scrap—the daily rework bill totals 4,488 euros. Across a 22-day month, that is 98,736 euros. Annually, the plant was burning over 1.18 million euros on hidden waste that did not appear as a quality failure in standard financial reporting.
This money was not marginal. It represented the salaries of an entire engineering team, a capital investment in new automated equipment, or a proactive preventative maintenance programme. Management cannot prioritise these investments if they do not see the cost. RTY translates operational defects into the language executives understand: cash.
Traditional yield is a painkiller that masks symptoms while the disease progresses.
Implementing RTY in an ISO 9001 System
Deploying RTY requires a disciplined approach to shop-floor data capture. You cannot calculate it retrospectively from final inspection logs. The first step is identifying the critical 5 to 15 operations per line where defects are historically born. Operations that handle high-value components or alter the product irreversibly must be prioritised.
At each critical station, operators must record three data points: total units entering the operation, units passed defect-free on the first attempt, and units requiring repair or downgrade. The formula is simple: FTY equals units passed first time divided by total units entering. This data capture must become a mandatory part of the standard work, not an afterthought.
Calculate and display the RTY trend daily, weekly, and monthly. A single measurement is interesting; a trend is actionable. When RTY begins to drop, it serves as an early warning system long before defective product reaches final inspection or the customer. Tie this trend directly to your 8D problem-solving process to ensure deviations trigger immediate root cause analysis.
Deploying RTY on the Shop Floor
- 01Identify Critical OperationsSelect the 5-15 high-risk stations where value is added or permanently altered.
- 02Capture First Time YieldLog total units in, units passed first time, and units repaired at the station.
- 03Calculate Daily RTYMultiply sequential FTY figures to establish the true process probability.
- 04Quantify Hidden CostsTranslate the RTY gap into scrap, labour, and material currency for management.
- 05Prioritise Bottleneck FixesTarget the single lowest FTY station to achieve the maximum RTY uplift.
Targeted Improvement and Systemic Change
Improving RTY requires focusing on the bottleneck operation. In the Slovakian plant, the data pointed directly at the welding station. The quality team analysed the 8D records and discovered 60% of welding deviations originated from inconsistent machine parameter setups between shifts. A standardised setup sheet and a visual verification checklist eliminated the majority of these defects, pushing welding FTY from 94.8% to 97.9%.
Assembly presented a different challenge. Operators were using three conflicting versions of work instructions, leading to variation in component placement. Unifying the standard work and implementing a simple poka-yoke—a magnetic jig that physically prevented incorrect orientation—raised assembly FTY from 95.9% to 98.4%. These targeted fixes lifted the plant's overall RTY from 81.3% to 86.5%.
That 5.2% improvement in true RTY meant 89 fewer products requiring rework every single day. The financial impact was immediate: saving over 1,068 euros daily, which scaled to nearly 280,000 euros annually. This was achieved without purchasing new machinery; it was driven purely by identifying the true FTY, targeting the weakest links, and applying standard lean manufacturing and quality tools.
Metrics Selection and Industry 4.0 Integration
RTY does not replace all other metrics; it contextualises them. Traditional Yield remains useful for high-level financial reporting and customer-facing documentation. FTY is essential for shift leaders managing individual stations. Defects Per Million Opportunities (DPMO) and Sigma Level remain critical for Six Sigma projects and benchmarking across different product families.
Rolled Throughput Yield fills the strategic gap. It is the metric that links the operational reality of the shop floor to executive-level decision-making. It exposes systemic weaknesses and provides a mathematical basis for prioritising engineering resources. Ignoring RTY means you are flying blind, optimising individual stations while the overall process bleeds cash.
Modern MES platforms and IoT sensors make RTY calculation highly visible. I have visited facilities where automated sensors capture first-pass yield at every station, feeding real-time RTY dashboards directly to the line. When RTY drops below a defined threshold, an Andon system triggers immediate response from engineering, rather than waiting for an end-of-shift quality report. Technology accelerates the feedback loop, but the fundamental requirement remains: management must act on the truth the metric provides.