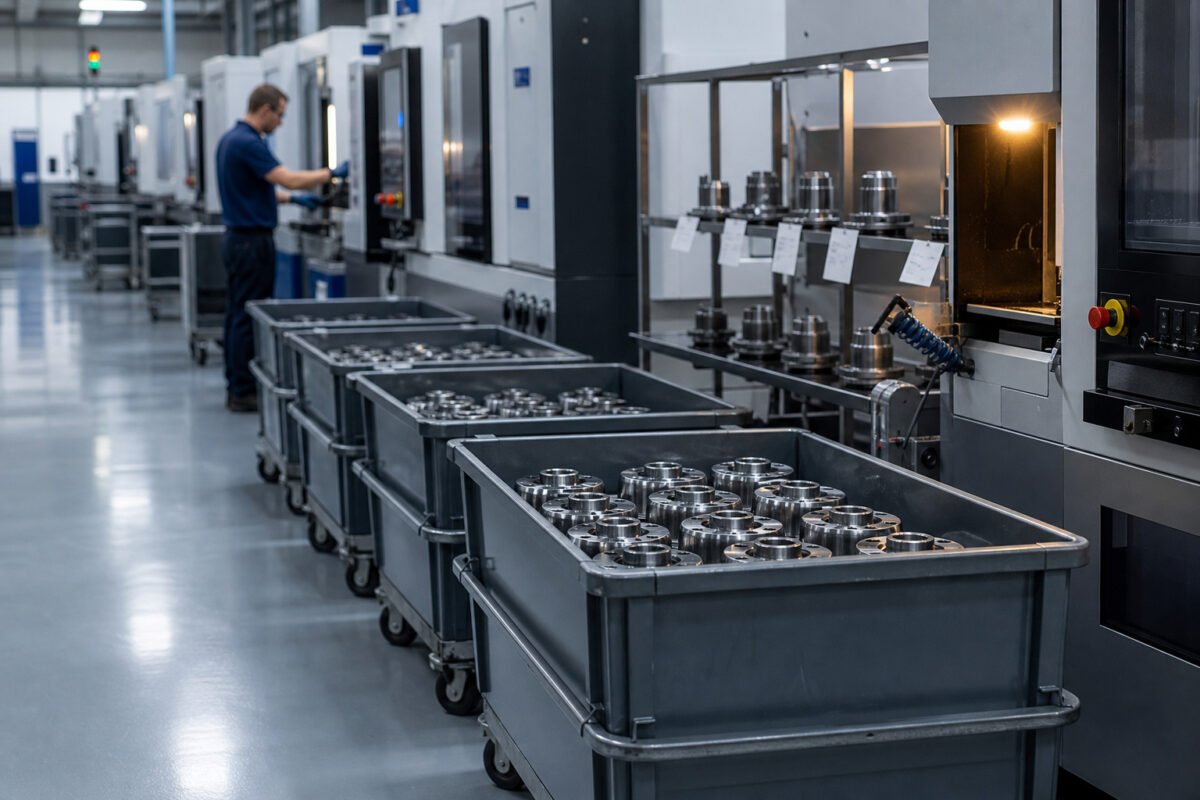
A staged run at rate follows a script. The customer audit team arrives, the line has been cleaned, staffed with the best operators, loaded with the best material lots and warmed up with two shifts of practice. Everything runs beautifully, everyone signs. Three weeks later volume production begins and the line delivers half the promised rate with scrap levels nobody forecast. I have sat through more of these events than I care to count, and the pattern rarely varies.
The purpose of a run at rate is to prove the process can sustain the contracted volume under realistic conditions: the actual crew, the actual maintenance state, the actual material variation the line will see daily. Anything else is theatre, and theatre has a cost that surfaces the moment the first real order lands. The gap between demonstrated and actual capacity is one of the most reliable predictors of launch failure I know.
The distinction matters because capacity and quality claims are usually proven separately, by different people, at different times. Engineering proves rate with a stopwatch and a clean machine. Quality proves capability with a short study on stable parts. Nobody proves them together, under load, with everything going slightly wrong at once. That intersection is precisely where launches fail.
What a genuine rate demonstration must include
A real run at rate has defined duration, volume, crew and conditions, all written down before the event and agreed with the customer. Duration matters most. A two-hour demonstration tells you almost nothing because most failure modes — tool wear, chip evacuation, adhesive pot life, operator fatigue, thermal drift — reveal themselves over hours, not minutes. I insist on a minimum of one full shift, and for high-volume automotive work I prefer consecutive shifts, because shift-to-shift handover is itself a failure mode you need to observe.
The volume target should equal the contracted daily rate plus a margin for planned downtime, changeover and realistic scrap. If the contract says forty thousand pieces a day and the line only achieves that with zero downtime, you have not demonstrated capacity — you have demonstrated a line with no tolerance for reality. Build the downtime allowance into the target and prove the line can absorb it.
Crewing is where most demonstrations cheat. The A-team runs the trial; the C-team runs production. Insist that the crew scheduled for actual serial production runs the rate trial, including new hires and the operators still in training. If they cannot hold the rate, you have found something more valuable than a signature: a training gap with time to fix it before launch.
Agree the conditions in writing with the customer before the event. An unsigned trial plan invites post-hoc negotiation, and every ambiguity will be resolved in favour of the more flattering interpretation. The plan should name the shifts, the lots, the inspection frequency and the exclusion rules — the last of these matters more than most teams realise.
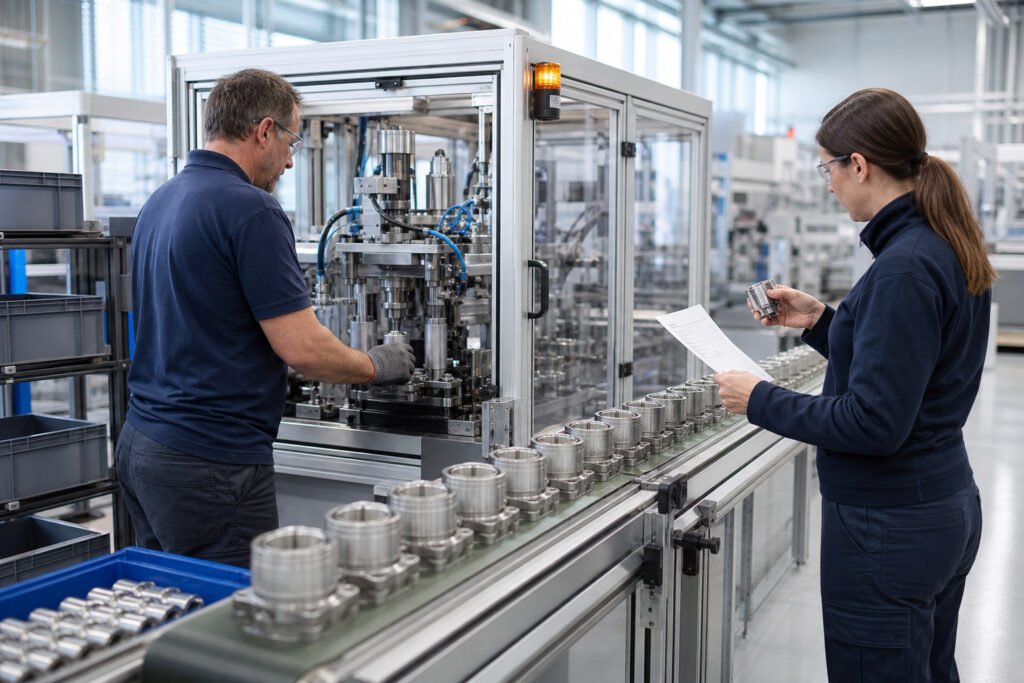
Bottleneck exposure: where the line actually fails
Every plant manager will tell you the bottleneck is the machine with the longest cycle time on the process sheet. In my experience they are usually wrong. The true bottleneck under load is often the operation nobody measured: the deburring station with one operator and a queue of thirty parts, the inspection bench that becomes the pacing operation the moment sample frequency increases, the wash machine whose drain cycle stalls every fiftieth part.
A proper run at rate forces these into the open because you are running sustained volume, not bursts. Watch the work-in-process between operations. Wherever the queue grows continuously through the trial, you have found a hidden constraint. Chart WIP by station at fixed intervals — every thirty minutes is usually enough — and the bottleneck announces itself as the station downstream of the largest accumulating pile.
Tooling exposes a second class of bottlenecks. Cutter life, weld tip dressing intervals, adhesive open time and fixture clamp wear all degrade rate over hours. A trial that stops and resets tooling every fifty parts proves nothing. Let the tooling run to its real change interval and record what happens to cycle time and part quality at the end of that interval. The last fifty parts before a scheduled tool change are often the most informative of the entire event.
How to expose the true constraint during a rate trial
- 01Fix the observation intervalRecord WIP between every station every 30 minutes, without exception.
- 02Chart queue growthA queue that grows continuously marks a hidden constraint, not a bad day.
- 03Run tooling to change intervalRecord cycle time and quality drift at the end of tool life, not after a reset.
- 04Identify downstream starveThe station starved by the accumulating pile confirms the constraint upstream.
- 05Repeat on consecutive shiftsA constraint that moves between shifts points to crewing, not equipment.
Realistic conditions: deliberately spoiling the perfect day
A meaningful run at rate should include deliberate adversity, planned and documented. This is not sabotage; the trial conditions must reflect the range the process will actually see. Run with material from at least two different incoming lots, including one at the edge of the specified tolerance band. Run with the second-choice material supplier if you have one qualified. Run with the ambient conditions you will see in July, not just March, if thermal growth affects your fixtures.
Interruptions belong in the trial too. Schedule a genuine changeover mid-event. Pull an operator for break relief by the person who will actually do relief work. Trigger one minor stoppage deliberately — a known fault the line routinely produces — and measure recovery time. What you are measuring is not whether stoppages occur but how long recovery takes, because recovery capability determines net output more than machine speed ever will.
Material handling deserves explicit attention. Forklift availability, container rotation, dunnage supply and line-side presentation all throttle rate in real production while being invisible in a demonstration where someone hand-carries parts to keep things moving. Ban heroics. If parts are moved by hand during the trial but by forklift in production, you have falsified the trial. Document the logistics plan and hold to it.
Measuring quality simultaneously, not afterwards
The quality proof must be embedded in the rate event, not bolted on afterwards. That means first-off and last-off parts at start-up, at every tool change and at the end of the run, all retained and labelled with their time stamps. It means in-process checks performed at the production inspection frequency by the production inspectors — not by the quality engineer who normally runs capability studies and knows exactly how to coax a good reading.
Sample parts across the entire run, deliberately including parts produced during degraded conditions: the parts made just before the tool change, the parts made immediately after a stoppage, the parts made from the borderline material lot. These define your worst case, and your worst case — not your average — is what serial production will deliver on a bad Friday.
The defect log from a good run at rate is a launch risk register in miniature.
Record every defect with location, time and suspected cause. If you see a repeating void in a casting at a consistent location, or burrs accumulating at a specific feature, you have captured a problem while it is still cheap. Feed the log directly into pre-launch containment decisions: which features need tightened inspection early, where to place auxiliary gauges, and what to brief the customer about honestly.
Reading the numbers honestly
Interpretation is where even honest trials get distorted. Record net output, gross output, total unplanned downtime by cause, scrap and rework counts, and cycle time per station at fixed intervals. Gross output alone flatters; net output after scrap, rework and downtime is the number that matches what the customer will receive. When someone reports the trial as a success on gross figures, ask for the net and watch the room go quiet.
Cycle time data deserves distributions, not averages. A station averaging fifty seconds is useless information if it runs forty-five seconds most of the time and ninety seconds whenever the part is at the heavy end of the tolerance band. Plot the distribution per station and mark which parts came from which material lot. Bimodal cycle time distributions almost always point to incoming variation the process is absorbing invisibly — until it isn't.
Compare demonstrated rate against contractual requirement with downtime and scrap losses already subtracted, and state the margin explicitly in the report. A margin so thin that one extra breakdown per shift erases it is not capacity, it is hope. I would rather write an honest report showing a shortfall with a corrective plan than a triumphant one that unravels in week three of production — and customers, in my experience, respect the former far more than they punish it.
Gross figures versus net truth
Flattering reading
- Gross output over the shift
- Average cycle time per station
- Best operators and best lots excluded from losses
- Recovery time ignored after stoppages
Honest reading
- Net output after scrap, rework and downtime
- Cycle time distribution, marked by lot
- Every unplanned stoppage logged by cause
- Recovery time measured and counted
Common failure modes of the event itself
Some failures are administrative rather than technical. The trial runs before the packaging specification is finalised, so the end-of-line packing station — often the true constraint — is never tested. The trial uses pre-series parts from a pilot tool while the production tool is still being cut. The trial runs on the day shift with full maintenance support while the night shift, with one technician covering six lines, is the shift that will actually carry the volume. Each of these I have seen void an otherwise excellent demonstration.
Watch for measurement contamination as well. If the customer's auditor wants a specific part measured mid-run and the line stops for twenty minutes to accommodate it, that stoppage and restart cycle must be logged and counted. Selective exclusion of unrepresentative periods is the quiet death of trial integrity. Define beforehand which exclusion categories are permitted — planned breaks, scheduled changeover — and count everything else against you.
The final failure mode is the absence of a decision rule. Agree before the event what constitutes pass, conditional pass and fail, and what happens in each case. A trial without decision criteria becomes a negotiation, and negotiations reward the persuasive rather than the prepared. Write the rule, run the trial, apply the rule, and act on the result.
That discipline — more than any single technical measurement — is what separates a genuine capacity and quality proof from the performance most plants stage. Across two decades in automotive and aerospace, I have never seen a launch fail because a run at rate was too honest. The failures come from demonstrations that confused a good Tuesday with a sustainable process.