Most quality effort goes into production. SPC charts, control plans, layered process audits, and final inspection all exist to catch defects after the process has already generated them. This detection-based approach is expensive, reactive, and fundamentally limited — you are sorting good from bad rather than preventing the bad.
Genichi Taguchi proposed a different premise. Instead of fighting variability in production, design the product and process so that variability has minimal effect on the output. This is robust design: the engineer's job is not to eliminate noise factors like humidity, tool wear, or material lot variation — it is to find control factor settings where those noise factors stop mattering.
In my experience transitioning quality systems at plants with hundreds of operators, the teams that adopt Taguchi methods shift where engineering time is spent. They stop chasing symptoms on the floor and start resolving variability at the parameter design stage, where a single optimisation run can replace months of corrective action.
The Taguchi Loss Function: Why Pass/Fail Is Not Enough
Traditional quality operates on a step function: inside specification is good, outside is bad. A part at nominal and a part at the tolerance limit are treated as equally acceptable. This model hides a critical reality — parts produced at the tolerance edge perform worse and create more downstream variation than parts produced at nominal.
The Taguchi loss function quantifies this penalty. It states that any deviation from the target value generates loss, proportional to the square of the deviation. The formula is L = k × (y – T)², where L is loss, k is a cost constant, y is the actual measured value, and T is the target. A part at 25.010 mm when the target is 25.000 mm incurs four times the loss of a part at 25.005 mm, even though both are technically in spec.
The consequence for production is direct. If your Cpk target is 1.33 and your process is centred, you are already incurring measurable loss on parts sitting near the control limits. Reducing variation around the nominal — not just staying within specification — is what drives down scrap, rework, warranty cost, and assembly line fit issues downstream.
Signal and Noise: The Architecture of Robust Design
Taguchi classifies process variables into three categories. Signal factors are the settings you control to hit the target — spindle speed, feed rate, injection pressure, cure temperature. Noise factors are the variables you cannot fully control or cannot afford to control — raw material lot variation, ambient humidity, tool wear between replacements, operator technique differences.

Control factors are the third category, and the one Taguchi methods focus on most. These are parameters that do not directly set the target but do determine how sensitive the output is to noise. Coolant flow rate, clamping force, fixture design, and tool coating are all control factors — they do not change the nominal dimension, but they dramatically change whether a 2-degree temperature swing in the shop pushes parts out of spec.
Robust design means finding the combination of control factor levels where noise factors have the smallest possible effect on the output. You are not trying to eliminate humidity or material variation — you are configuring the process so that those variations become statistically irrelevant to the finished dimension.
Conventional vs. Taguchi Approach to Variability
Conventional approach
- Inspect output, sort good from bad
- Tighten tolerances to force quality
- Treat in-spec parts as equally good
- React to variation after it appears
Taguchi approach
- Design process to resist noise factors
- Find control settings that minimise sensitivity
- Minimise deviation from nominal, not just stay in spec
- Resolve variation at the parameter design stage
Orthogonal Arrays: Efficient Experimentation
Full factorial experimentation is impractical for real processes. Testing four factors at three levels each requires 81 runs. With three replicates per run for statistical validity, you are at 243 trials — before accounting for setup time, material cost, and machine availability. Most production environments cannot dedicate that kind of resource to a single optimisation.
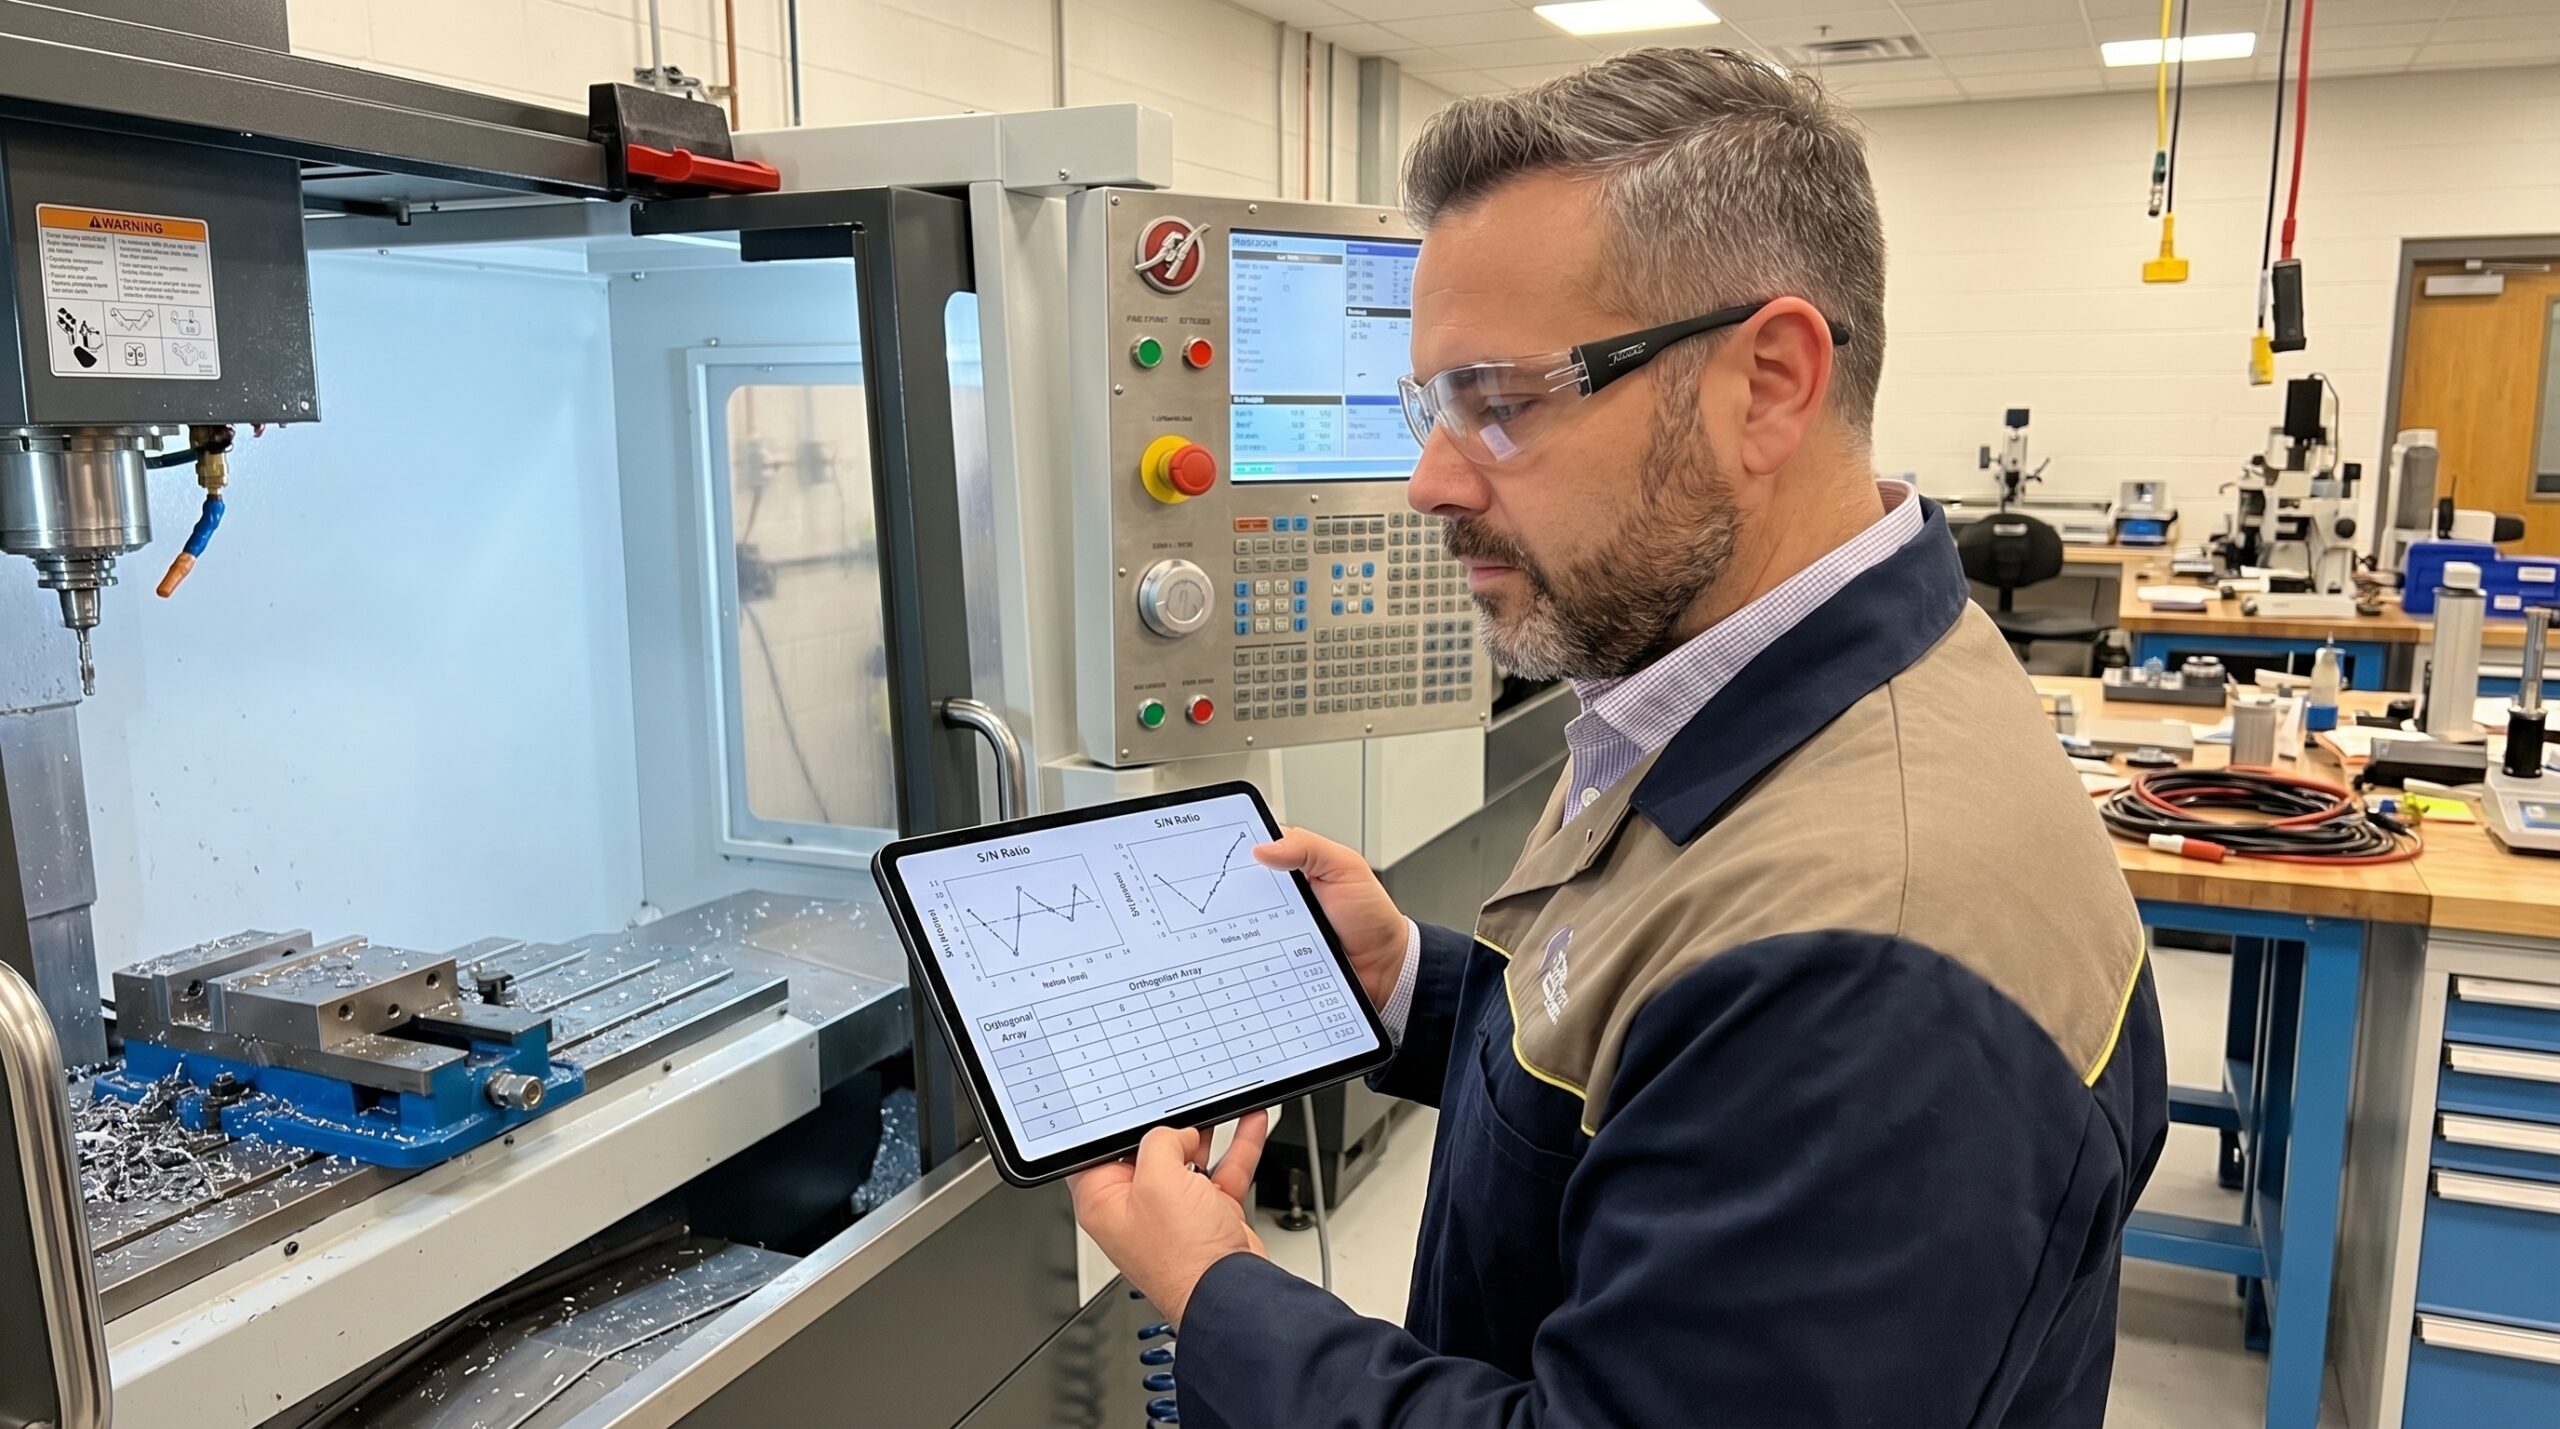
Taguchi solved this with orthogonal arrays — standardised experimental matrices that test only the key combinations of factor levels while still capturing main effects independently. An L9 array tests four factors at three levels in just nine runs. An L18 array handles one two-level factor and seven three-level factors in eighteen runs. The orthogonality property ensures that the effect of each factor can be evaluated independently of the others.
The trade-off is interaction effects. Orthogonal arrays are designed to detect main effects efficiently but do not fully resolve interactions between factors. For most parameter optimisation problems, main effects dominate the outcome, and the efficiency gain is worth the trade. If strong interactions are suspected, you can reserve columns in a larger array or follow up with a targeted full-factorial on the critical subset.
Selecting the right array follows from the number of factors and levels in your study. The L8 handles up to seven two-level factors; the L12 handles eleven. For mixed-level experiments — common when you have continuous process parameters alongside categorical factors like tool type or supplier — the L18 is specifically designed for that structure.
Signal-to-Noise Ratio: The Quality Metric
Taguchi replaces separate analysis of mean and standard deviation with a single metric: the signal-to-noise ratio. This ratio captures both the distance from target and the variation around that distance, giving you one number to maximise during optimisation. Higher S/N always means a more robust process — closer to target and less sensitive to noise.
Three S/N formulations cover the quality situations engineers encounter. Nominal-the-best applies when the target is a specific value — a bore diameter, a torque setting, a coating thickness. The formula is S/N = 10 × log(ȳ² / s²), combining the mean squared with the variance. Smaller-the-better applies to characteristics like reject rate, cycle time, or surface roughness, where the goal is to drive the value toward zero.
Larger-the-better covers characteristics like tensile strength, yield, or fatigue life, where the goal is to maximise the value. The formula is S/N = -10 × log(Σ(1/yi²) / n). In every case, the analysis procedure is the same: calculate S/N for each experimental run, then average the S/N values at each level of each factor. The level with the highest average S/N is your optimal setting.
This approach gives you a ranking of factor importance as a by-product. The difference between the highest and lowest average S/N across levels of a factor — called the delta — tells you which factors matter most. A factor with a delta of 8 dB has a far larger effect on robustness than one with a delta of 1 dB, and resources for process control should be allocated accordingly.
Running a Taguchi Experiment: From Cpk 0.9 to 2.4
Consider a milled component with a critical bore dimension of Ø50.000 ±0.025 mm running at Cpk 0.9. The process is technically capable of meeting specification but produces enough marginal parts to drive scrap and rework costs. A full characterisation study identified four factors worth investigating: cutting speed, cut depth, coolant flow, and tool type — each at three levels.
An L9 orthogonal array was selected. Nine runs, each replicated three times for S/N calculation, gave twenty-seven machined samples. The results were analysed by averaging the S/N ratio at each level of each factor. The optimal combination — 2500 RPM, 1.0 mm cut depth, 4 l/min coolant, and tool type B — was identified by selecting the highest average S/N level for each factor independently.
Taguchi Optimisation Sequence
- 01Define factors and levelsIdentify control factors from engineering knowledge and prior PFMEA data
- 02Select orthogonal arrayMatch array size to number of factors and levels — L9 for four factors at three levels
- 03Run experiments with replicationEach run replicated three times to enable S/N calculation and capture real noise variation
- 04Calculate S/N for each runApply nominal-the-best, smaller-the-better, or larger-the-better depending on the characteristic
- 05Identify optimal levelsAverage S/N at each factor level; select the combination with the highest values
- 06Run confirmation experimentMachine parts at optimal settings; verify mean, S/N, and Cpk improvement hold
The confirmation experiment is the critical step. Setting all four factors to their optimal levels produced a mean of 50.001 mm against the 50.000 target. The S/N ratio improved from 38.2 to 45.3 — a 7 dB gain that represents roughly a fivefold reduction in variability. Most importantly, Cpk moved from 0.9 to 2.4, far exceeding the 1.67 requirement for automotive safety-critical characteristics under IATF 16949.
A 7 dB signal-to-noise improvement translates to roughly a fivefold reduction in process variability — without tightening a single tolerance.
Where Taguchi Methods Fit and Where They Do Not
Taguchi methods are ideal for parameter design — the stage between concept design and full production launch where you are determining the optimal settings for a new process. They are equally effective on existing processes where variability is high and the root causes are distributed across multiple factors that interact in ways the team cannot resolve through single-variable experimentation.
APQP and PPAP workflows in automotive and aerospace naturally accommodate Taguchi experiments. The process design phase, before control plans are finalised and capability studies are locked, is the correct insertion point. Running an L9 or L18 array during this window means you launch production with a process that has been optimised for robustness, not merely verified for capability.
The methods are less appropriate for problems dominated by a single variable, where a simple A/B test is sufficient and the overhead of array selection and S/N calculation adds no value. They are also not a substitute for measurement system analysis — if your gauge R&R is above 10 percent, the S/N ratios from your experiment will reflect measurement noise as much as process noise, and the conclusions will be unreliable.
In environments where tolerances are measured in micrometres and the cost of poor quality runs into millions — automotive powertrain, aerospace structural machining, precision moulding — the return on a Taguchi experiment is immediate and verifiable. The confirmation run gives you the evidence. The Cpk improvement gives you the justification. The reduced scrap rate gives you the money.