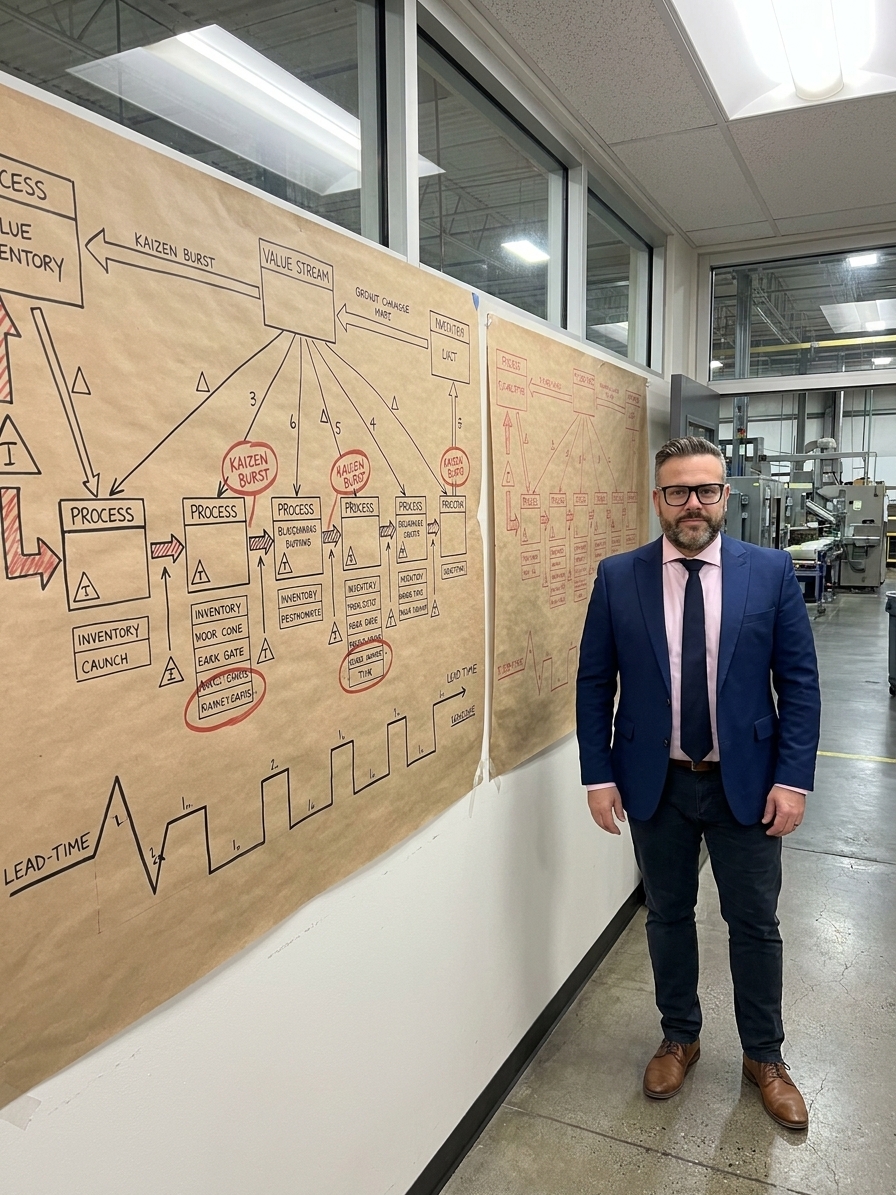
A cross-functional team spends three days in a conference room with an external facilitator. They walk the floor, time processes, and draw boxes, triangles, and kaizen bursts on butcher paper. They calculate takt time, cycle time, and inventory turns. They discover that a product with 45 minutes of processing time sits in the factory for 23 days. The room goes quiet.
Then the facilitator packs up and bills the engagement. The future-state map stays on the wall for six months. The production supervisor who was not invited to the event continues scheduling as before. The ERP system continues pushing work orders based on MRP explosions. Within a year, nobody remembers where the map is stored.
This is how Value Stream Mapping unfolds in most organisations. The current-state map — the diagnosis — becomes the deliverable. The future-state map becomes an aspiration. The waste identified with such precision continues exactly as before. The act of mapping substitutes for the act of improving.
What VSM Actually Produces
Value Stream Mapping is a lean tool developed at Toyota, where it is called material and information flow mapping. It visualises the entire flow of materials and information from raw material to customer delivery. Unlike a process flowchart, it captures inventory accumulations, push versus pull connections, and the quantitative data that reveals where time is actually spent.
The data box for each process step captures cycle time, changeover time, uptime, batch sizes, scrap rate, and available work time. The timeline at the bottom of the map separates processing time from waiting time. When organisations first see that less than 5% of total lead time is actual processing, the reaction is usually stunned silence. This is the diagnostic power of the tool.
But the output of VSM is not the current-state map. The output is the future-state map — a redesigned value stream that eliminates waste, establishes flow, introduces pull where appropriate, and drives toward levelled production. The current-state map is the diagnosis. The future-state map is the prescription. Implementation is the cure. In most organisations, implementation never happens, and the diagnosis becomes the deliverable.
The Three Phases of VSM Failure
VSM failure follows a predictable pattern. Phase one is the event: enthusiasm, cross-functional engagement, floor walks, real gemba observation. The team discovers that supplier lead time everyone assumes is two weeks is actually five. This part is genuinely valuable. People see the value stream as a connected whole for the first time.
Phase two is the map. The team reconvenes and draws. Data boxes get filled in. Lead time is calculated. The gap between processing time and lead time is revealed. The future-state map is drawn, kaizen bursts are circled, and an implementation plan is sketched. The facilitator leaves and tells the executive that the real work begins now.
Phase three is the fade. A few quick wins are attempted — a 5S cleanup, a kanban trial. Then the first obstacle appears. The ERP system cannot support pull signals. The supplier refuses to change delivery frequency. The engineering team has a capacity constraint. Week by week, the energy dissipates. The kaizen bursts remain unburstable, and within six months the map is taken down to make room for a safety poster.
Mapping Without Authority
The most common failure mode is structural: the mapping team has the authority to diagnose but not to change. They can walk the floor, time processes, and draw maps. They cannot renegotiate supplier contracts, reassign operators, reconfigure equipment, or override production schedules. The future-state map identifies changes requiring decisions from people who were not in the room.
At Toyota, value stream improvement is led by line management. The people who own the process map it and change it. In most Western organisations, VSM is delegated to staff and middle managers who can recommend but not decide. The result is a precise map attached to no accountable owner. I have audited plants where the future-state map was genuinely excellent — and the production manager could not explain what it meant for his daily scheduling decisions.
The mapping team becomes a recommendation body in an organisation that requires command authority. The departments controlling the constraints — IT, procurement, engineering — were not in the event and have no incentive to disrupt their operations to implement someone else's vision. The map documents the waste; the organisation's structure guarantees it persists.
The ERP Contradiction
Most future-state maps envision some form of pull system: kanban cards, supermarket inventories, FIFO lanes, or make-to-order triggers at pacemaker steps. Most ERP systems are designed for push production. They generate work orders, allocate inventory, and schedule operations based on forecasts and MRP explosions. These two systems are in direct conflict.
Implementing pull means fighting the ERP at every step. Teams manually override work orders, create phantom part numbers to represent kanban loops, and run parallel scheduling systems. The alternative is a multi-year ERP reconfiguration that nobody wants to fund. So the pull system stays on the map and the push system stays in the factory. The future-state map becomes fiction.
Map Versus Reality: The Pull-Push Gap
What the future-state map specifies
- Kanban triggers based on downstream consumption
- Supermarket inventory at defined pull locations
- FIFO lanes connecting uncoupled processes
- Pacemaker scheduling at a single production control point
What the ERP system enforces
- Work orders generated from MRP explosions
- Inventory allocated against forecast demand
- Push scheduling to all work centres simultaneously
- Variance reporting against standard cost assumptions
Scope, Complexity, and the Current-State Obsession
A value stream map should cover one product family on one line, drawn on a single sheet of paper, readable in five minutes by someone who has never seen it before. Toyota maps one value stream at a time with disciplined scope. The discipline of scope is part of the discipline of improvement.
Instead, mapping teams decide to map the entire factory. The map grows to cover an entire wall, then two walls. It becomes so complex that nobody can hold it in their head. The complexity itself becomes a barrier to implementation — you cannot improve what you cannot discuss coherently in a meeting. When you try to map everything, you improve nothing.
A related failure is the current-state obsession. The revelation of how long things actually take versus how long you thought they took is powerful. But the current-state map is a diagnostic, not a result. Spending three months perfecting it — adding detail, refining data box numbers, mapping additional families — is procrastination dressed as diligence. Organisations that perfect the map but never implement have confused the photograph with the patient.
The Governance Vacuum
The VSM event produces a future-state map and an implementation plan. What it usually does not produce is a governance mechanism: a standing team, a budget, a project manager, a milestone timeline, or an executive sponsor. Without governance, the implementation plan is a wish list and the kaizen bursts are suggestions.
Real VSM governance looks like this: weekly 30-minute reviews of implementation progress. Monthly steering reviews with an executive sponsor. A tracking board showing each change, its owner, its status, and its measured impact. Re-mapping every 90 days to verify what actually changed. The map is a living document, reviewed and updated, not a frozen artifact.
The difference between mapping and drawing is the difference between improvement and decoration.
VSM is a tool that assumes a certain level of organisational maturity. It assumes the organisation can make cross-functional decisions and enforce them, invest in infrastructure changes, sustain improvement focus beyond a single event, and manage by value stream rather than by department. Most organisations that attempt VSM do not have this maturity. The map does not create it; it exposes the lack of it.
The Cost of VSM Theatre
The direct cost of a VSM event — facilitator fees, team time, materials — is significant but survivable. The invisible cost is worse. When an organisation invests in VSM and fails to implement, it teaches the workforce that improvement initiatives are performative. The operators who shared real insights about waste learn that their input does not matter.
The next time someone walks the floor with a clipboard, those operators provide rote answers and minimal cooperation. They have been trained that the exercise leads nowhere. This learned cynicism is more damaging than the waste the map identified. Waste can be eliminated. Cynicism must be unlearned, and that takes far longer.
An organisation that has been through three VSM events with no implementation is harder to improve than one that has never attempted VSM at all. The first organisation no longer believes improvement is possible. The second has not yet been inoculated against it.
Governance Cycle for Sustained VSM Implementation
- 011. Scope and OwnershipOne product family, one line manager with authority to implement changes.
- 022. Map Current and Future StateInclude IT and supply chain constraints in the mapping event, not after.
- 033. Limit to 3-5 ChangesSpecific, measurable changes with named owners and timelines.
- 044. Govern Weekly30-minute status reviews. Escalate blockers to executive sponsor.
- 055. Re-map Every 90 DaysMeasure lead time reduction. Identify the next 3-5 changes. Repeat.
What Real VSM Looks Like
When value stream mapping works, it is owned by line management, not by staff. The person responsible for the value stream leads the mapping, owns the future-state map, and is accountable for implementation. IT and supply chain managers are in the room from day one. If they cannot commit to the changes needed, the future-state map accounts for that — or the scope narrows to what is achievable.
A good future-state map identifies three to five high-impact changes, not fourteen kaizen bursts. The team implements those changes in 90-day cycles, then re-maps. Iteration beats ambition. The single most powerful metric is total lead time versus processing time. If the map shows 23 days of lead time for 45 minutes of processing, implementation is measured by whether lead time shrinks.
Not by how many kaizen events were held. Not by how many maps were drawn. Not by how many people were trained. Did lead time go down? If not, the VSM failed, regardless of how good the maps look. The map is not the territory. Only sustained, governed, resourced implementation — led by line management, supported by IT and supply chain, measured by lead time reduction, repeated in cycles — changes anything.