Plant dashboards typically report cycle times, scrap rates, and OEE for individual machines. When each station hits its targets, management assumes the plant is performing well. Yet customer complaints keep rising, lead times stretch, and work-in-progress inventory bloats.
This happens because quality professionals are trained to monitor process capability and specification compliance, not the connections between processes. Parts leaving a perfectly optimised station might sit in a queue for thirty-six hours before the next operation touches them. During that wait, parts accumulate handling damage, dust settles on critical surfaces, and labels degrade.
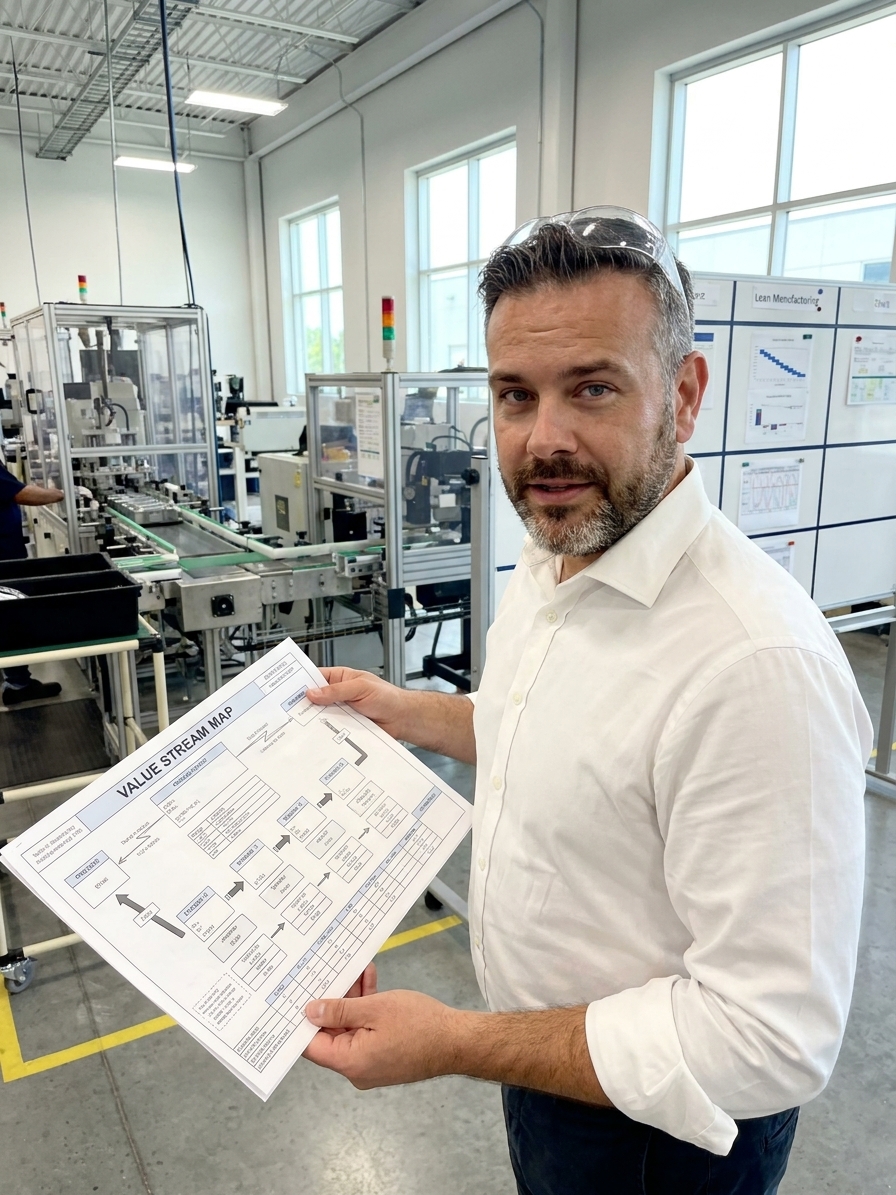
Value Stream Mapping (VSM) exposes this hidden degradation. Developed within the Toyota Production System, VSM is a visual tool that traces the complete path of a product family from raw material to customer delivery. It distinguishes itself from standard process mapping by revealing exactly how long nothing happens, exposing the ratio of value-adding time to total lead time.
Diagnosing the Current State on the Shop Floor
Every proper value stream exercise begins with a current state map. This is a brutally honest photograph of reality, drawn from direct observation at the gemba. It captures what actually happens, not what the ERP system assumes or what the standard operating procedures dictate.
To build it, you must walk the floor and time every step. The map records cycle times, changeover durations, actual equipment uptime versus nameplate capacity, batch sizes, and inventory levels between stations. It also maps the information flow, showing how customer orders trigger production schedules.
When you calculate the metrics, the results are usually humbling. A part might require 4.2 minutes of actual processing time but take 11.4 days to travel through the factory. The value-adding ratio drops to a fraction of a percent. The map makes clear that the vast majority of lead time consists of waiting, moving, counting, and sitting.
Designing the Engineered Future State
VSM transitions from a diagnostic tool to a design tool when you draw the future state map. This is not an exercise in waste removal; it is a reimagining of production flow. The future state is engineered, meaning every proposed change is specific, measurable, and tied to a concrete implementation plan.
The design process asks where you can establish continuous flow instead of batch-and-queue operations. It forces you to identify the pacemaker process—the single point where production is scheduled—and determines where supermarket pull systems are needed to regulate inventory and prevent overproduction.
A realistic future state targets a 50 to 70 percent improvement in lead time within six to twelve months. It must be designed for the real world, accommodating actual demand patterns and capital constraints. A future state that requires flawless demand and unlimited resources is useless fantasy.
Standard VSM Efficiency Targets
The Hidden Flows That Generate Nonconformities
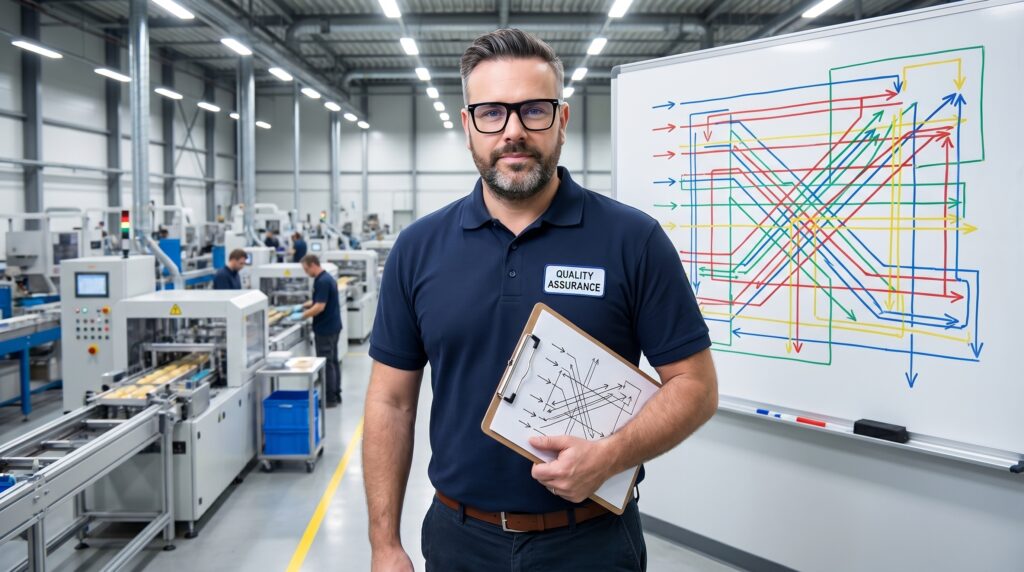
Most quality defects originate between processes, not within them. Parts do not teleport between stations; they travel by cart, conveyor, or forklift. Each physical movement is an opportunity for damage, misidentification, or loss. VSM traces these handling steps, revealing undeclared operations that evolved over time rather than by design.
I once investigated burr defects at an automotive stamping plant. The quality team had spent months adjusting press parameters and tightening dies. The VSM revealed that coil steel was moved seven times by forklift before it reached the press. The root cause of the burr was not the stamping process; it was the fork tine denting the coil edge during the fifth move.
Information flow failures are equally destructive. When a customer change order takes seventy-two hours to route through engineering and purchasing before reaching the floor, the old specification is still being produced. Those parts become nonconforming inventory. Decision flow also falters when operators at a downstream station spot a defect but lack the authority to stop the line.
Quality problems often originate not within processes, but in the flows that connect them.
Integrating VSM with Core Quality Tools
There is a persistent misconception that VSM is a lean logistics tool, unsuited for quality management. In reality, VSM provides the operational context that makes standard quality tools more effective. A PFMEA becomes significantly more accurate when you understand the handoffs and queues encoded in the value stream.
VSM identifies where quality is built into the process versus where it is inspected in after the fact. Combined with FMEA thinking, the map highlights the critical control points where quality investment yields the highest return. It shifts the focus from detecting defects to making them impossible through better process design.
CAPA investigations also reach deeper root causes when they trace an error through the entire flow. A mislabeled container at packaging might trace back to a batching decision made three days earlier in machining. SPC charts tell a much richer story when you know the material handling conditions upstream from the measurement point.
Quality-Focused VSM Implementation Sequence
- 01Scope and ObserveSelect a product family, define boundaries, and walk the gemba to time actual processes.
- 02Draw Current StateMap reality using standard icons and calculate total lead time versus value-adding time.
- 03Diagnose Quality RisksApply PFMEA and Pareto analysis to prioritise the issues with the greatest quality impact.
- 04Design Future StateEngineer continuous flow, implement pull systems, and define the pacemaker scheduling point.
- 05Execute and TrackImplement changes and measure progress strictly against the future state metrics.
Anti-Patterns That Derail Mapping Exercises
I have seen more value stream mapping exercises fail than succeed. The most common failure mode is the conference room map. Drawing a value stream from memory in a meeting room guarantees you will get the major landmarks right while missing everything that matters. The current state must be drawn from direct observation, timed with a stopwatch, and verified on the floor.
Another frequent anti-pattern is the one-product trap. A value stream is defined by a specific product family, not the entire factory. Mapping every product creates an unreadable mess. Teams must select a family that represents a significant portion of volume and complexity, then map that specific stream end to end.
Finally, the map-without-action is a diagnosis without a treatment plan. Teams invest weeks drawing a beautiful current state map, present it to leadership, receive nods of appreciation, and file it away. The value of VSM lies entirely in the future state design and the kaizen execution plan that follows.
The System Output of Optimised Connections
When a facility executes VSM correctly, the results are systemic. At the aforementioned precision components plant, the future state design focused on four engineered changes: connecting two bottleneck stations with a first-in-first-out lane, implementing a pull system to replace push scheduling, levelling the production mix at a single pacemaker point, and moving quality checks inline.
Within four months, total lead time dropped from 11.4 days to 3.1 days. Customer complaints fell by 61 percent. The defect rate at final inspection dropped by 44 percent. None of these gains occurred because an individual station improved its cycle time or tightened its tolerances.
The improvements happened because the parts spent less time degrading between processes. As the quality manager noted, making individual stations better for three years yielded worse system performance. Making the connections better for three months improved everything, including the stations. Your organisation is a system of connections, and quality is determined by the space between the machines.